
How to Run Regression Excel?
Running a regression analysis in Excel can be a powerful tool for identifying relationships between different variables. It can help you uncover the underlying patterns in your data and make better business decisions. In this article, we’ll explain the basics of running a regression analysis in Excel and provide some tips on how to get the most out of it. We’ll also provide some examples to help you better understand the process. With our help, you can start using regression analysis in Excel to make more informed decisions and uncover hidden trends in your data.
How to Run Regression in Excel?
- Open Microsoft Excel.
- Input your data into the Excel sheet.
- Select the two columns that contain your data.
- Go to the “Insert” tab and click on “Scatter.”
- Select “Scatter with only Markers.”
- Go to the “Layout” tab and select “Trendline.”
- Select “More Trendline Options.”
- Select “Linear” under “Trend/Regression Type.”
- Check the box to display “Equation on chart” and “R-squared value on chart.”
- Click “Close” to finish.

Introduction to Running Regression Analysis in Excel
Regression analysis is a powerful statistical tool used to analyze the relationship between two or more variables. It can be used to determine the strength of the relationship between the variables and to make predictions about the data. Microsoft Excel is a powerful spreadsheet application that can be used to perform a variety of statistical analyses, including regression analysis. This article will provide an overview of how to run regression analysis in Excel.
Steps to Prepare Your Data for a Regression Analysis
Before running a regression analysis in Excel, it is important to ensure that the data is properly prepared. This includes making sure that the data is in the correct format, that any missing values are accounted for, and that any outliers are removed. It is also important to make sure that the data is properly labeled and that any variables are correctly coded.
The next step is to decide which type of regression analysis to use. The most common types of regression analysis are linear regression, logistic regression, and polynomial regression. Depending on the data and the goal of the analysis, one or more of these types of regression may be a good fit.
Finally, the data should be organized into columns, with each variable in its own column. This will make it easier to set up the regression analysis in Excel.
Using Excel for a Regression Analysis
The first step in running a regression analysis in Excel is to enter the data into the spreadsheet. This can be done manually, or the data can be imported from an external source. Once the data is entered into the spreadsheet, the regression analysis can be set up.
Setting Up the Regression Analysis
The first step in setting up the regression analysis is to select the type of regression to use. This can be done by clicking the “Data Analysis” option in the Data tab of the ribbon. From there, select the type of regression to use.
Entering the Data
Once the type of regression is selected, the data must be entered into the spreadsheet. This includes entering the independent variables, the dependent variable, and any other variables that may be included in the analysis. The independent variables should be entered into columns, with each variable in its own column. The dependent variable should be entered into the last column.
Running the Regression Analysis
Once the data is entered into the spreadsheet, the regression analysis can be run. This can be done by clicking the “Calculate” button in the Data tab of the ribbon. This will run the regression analysis and generate a report with the results.
Interpreting the Results of a Regression Analysis
Once the regression analysis is run, the results must be interpreted. The results of the analysis will include the regression equation, the coefficient of determination (R-squared value), and the P-value. The R-squared value is a measure of how closely the data fits the regression equation, while the P-value is used to determine if the results are statistically significant.
Interpreting the Regression Equation
The regression equation is used to predict the value of the dependent variable based on the values of the independent variables. The equation is of the form Y = a + bX, where Y is the dependent variable, a is the intercept, b is the coefficient of the independent variable, and X is the independent variable. The coefficient of the independent variable can be interpreted as the change in the value of the dependent variable for each unit change in the independent variable.
Interpreting the R-squared Value
The R-squared value is a measure of how closely the data fits the regression equation. It is a measure of the amount of variance in the data that is explained by the regression equation. A higher R-squared value indicates a better fit, while a lower R-squared value indicates a poorer fit. Generally, an R-squared value of 0.8 or higher is considered to be a good fit.
Interpreting the P-Value
The P-value is used to determine if the results of the regression analysis are statistically significant. The P-value is the probability that the results are due to chance. Generally, a P-value of 0.05 or lower is considered to be statistically significant.
Conclusion
Running regression analysis in Excel can be a powerful tool for analyzing the relationship between two or more variables. This article has provided an overview of how to run regression analysis in Excel, including how to prepare the data, set up the analysis, and interpret the results. With the proper preparation and understanding of the results, Excel can be a powerful tool for performing regression analysis.
Related FAQ
What is Regression Analysis?
Regression analysis is a statistical technique used to study the relationship between one or more independent variables (predictors) and a dependent variable (outcome). It is used to determine how changes in the independent variables, such as price, income, or other factors, affect the dependent variable. Regression analysis can also be used to identify the strength of the relationship between variables and to test hypotheses about cause and effect.
What Version of Excel do I Need to Run Regression?
You need Microsoft Excel version 2010 or later to run linear regression analysis in Excel. However, you can use older versions of Excel to perform basic linear regression.
How do I Run Regression Analysis in Excel?
To run regression analysis in Excel, you must first enter your data into an Excel spreadsheet. After your data is entered, follow these steps:
1. Select the data range, including the independent and dependent variables.
2. Click the “Data” tab, then click “Data Analysis” in the Analysis group.
3. Choose “Regression” from the list of data analysis tools and click “OK”.
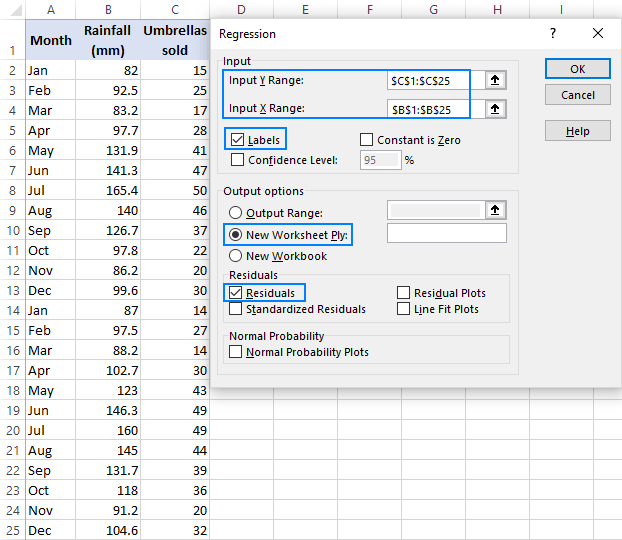
4. Enter the input and output ranges for the regression analysis.
5. Enter a name for the regression output and click “OK”.
6. View the regression analysis results in a new worksheet.
What Output Does Regression Analysis Provide?
Regression analysis provides several outputs that help you interpret the results. These outputs include the regression equation, which is a mathematical equation that describes the relationship between the independent and dependent variables. Other outputs include the R-squared value, which measures the strength of the relationship between the two variables, and the coefficient of determination, which is a measure of how well the model fits the data. There are also other outputs such as the predicted values, standard error, and p-values.
What is the Difference Between Linear and Nonlinear Regression?
Linear regression is a type of regression analysis that assumes a linear relationship between the independent and dependent variables. Nonlinear regression is a type of regression analysis that assumes a nonlinear relationship between the independent and dependent variables. Nonlinear regression is more complex and requires more data points than linear regression.
What are the Assumptions of Regression Analysis?
Regression analysis assumes that there is a linear relationship between the independent and dependent variables, that there is no multicollinearity among the independent variables, and that the errors are normally distributed and independent. It also assumes that the independent variables are measured without error and that the regression model is correctly specified.
What Are the Advantages of Regression Analysis?
Regression analysis is a powerful tool that can be used to identify relationships between variables and to make predictions about future outcomes. It is also relatively easy to use and can provide useful insights into complex relationships between variables. Additionally, regression analysis can be used to test hypotheses about cause and effect, and it can help identify variables that are important for decision-making.
Using Excel for Regression Analysis
Running regression in Excel is a powerful tool for analyzing data in order to make informed decisions. With the right knowledge and understanding, regression can be used to help you understand relationships between variables, identify trends, and make predictions. Knowing how to run regression in Excel can make all the difference in the accuracy of your analysis. With a few simple steps, you can start using this valuable tool to help you in your business decisions.
How to Use Concatenate in Excel?
How to Connect Unix Server From Windows?
Related Posts

Small businesses struggle with ERC tax credit submissions

10 Misunderstandings of the Employee Retention Credit

ERC Tax Credit 2023: Is the ERC tax credit still available?
