
How to Find the Slope of a Trendline in Excel?
If you want to understand the data behind an Excel graph, it’s important to know how to find the slope of a trendline. Knowing the slope of a trendline can help you better analyze and interpret the data, and can help you make more informed decisions. In this article, we’ll discuss the steps you need to take to find the slope of a trendline in Excel. With this information, you’ll be able to better understand the data behind your graph and make more informed decisions.
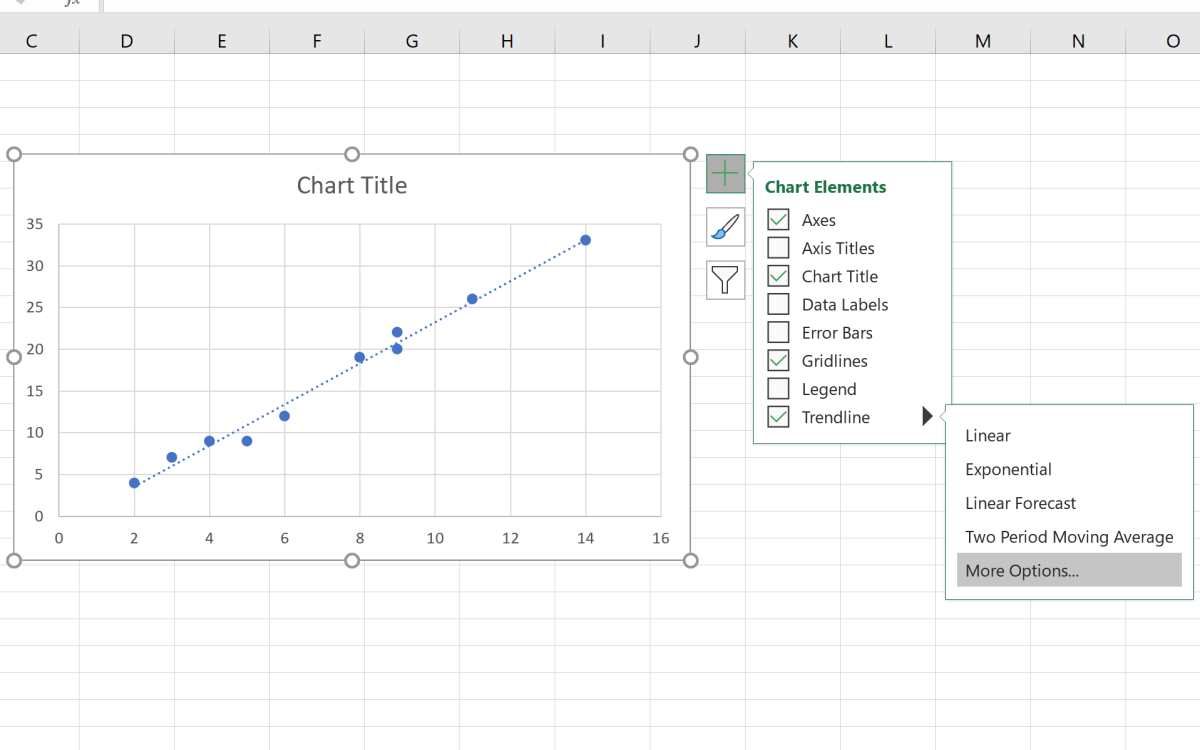
To find the slope of a trendline in Excel, first click on the “Chart Elements” button to add the trendline to a graph. Next, right-click on the trendline and select “Format Trendline”. Finally, select “Linear” from the “Trendline Options” menu and the slope will be displayed in the formula box.
Step-by-Step Tutorial:
- Click on the “Chart Elements” button to add the trendline to a graph.
- Right-click on the trendline and select “Format Trendline”.
- Select “Linear” from the “Trendline Options” menu.
- The slope will be displayed in the formula box.

What is the Slope of a Trendline?
The slope of a trendline is the rate of change of a variable with respect to another variable. It is a measure of how steeply a line rises or falls. It is also known as the gradient of the line, and is usually expressed as a ratio or a number. In Excel, the slope of a trendline can be calculated using the SLOPE function.
The SLOPE function returns the slope of a straight line that best fits the given data points. This function is useful for analyzing the relationship between two variables, such as sales and revenue. It can help us determine how much the dependent variable changes for every unit change in the independent variable.
Understanding the SLOPE Function
The SLOPE function takes two arguments: the known_ys and known_xs. The known_ys argument is an array of the y-values of the data points, while the known_xs argument is an array of the x-values of the data points. The function returns the slope of a line that best fits the given data points.
For example, if we have the following data points: (2,3), (4,6), (5,7) and (7,9), we can use the SLOPE function to calculate the slope of the line that best fits the data points. To do this, we can use the following formula:
=SLOPE(known_ys, known_xs)
In this case, the known_ys are the y-values of the data points (3,6,7 and 9) and the known_xs are the x-values of the data points (2,4,5 and 7). So, the formula is:
=SLOPE(3,6,7,9,2,4,5,7)
The result of the formula is 2, which means that the line that best fits the data points has a slope of 2.
Finding the Slope of a Trendline in Excel
When working with data in Excel, it is often useful to create a chart to visualize the relationship between two variables. The chart can then be used to find the slope of the trendline. To do this, follow the steps below:
1. Select the data points that you want to plot in the chart.
2. Create a chart from the selected data.
3. Right-click on the data series and select Add Trendline.
4. Select the Linear option from the list of trendline types.
5. Click the Options tab.
6. Check the Display Equation on Chart box.
7. Click OK.
The chart should now display the equation of the trendline. The slope of the trendline is the coefficient of the x-variable in the equation. For example, if the equation displayed on the chart is y = 2x + 1, the slope of the trendline is 2.
Using the SLOPE Function to Find the Slope of a Trendline
The SLOPE function can also be used to find the slope of a trendline. To do this, follow the steps below:
1. Select the data points that you want to plot in the chart.
2. Create a chart from the selected data.
3. Right-click on the data series and select Add Trendline.
4. Select the Linear option from the list of trendline types.
5. In the formula bar, enter the SLOPE function.
6. In the function arguments, enter the known_ys and known_xs.
7. Click OK.
The result of the SLOPE function will be displayed in the formula bar. This result is the slope of the trendline.
Using the SLOPE and INTERCEPT Functions to Find the Slope of a Trendline
The SLOPE and INTERCEPT functions can also be used together to find the slope of a trendline. To do this, follow the steps below:
1. Select the data points that you want to plot in the chart.
2. Create a chart from the selected data.
3. Right-click on the data series and select Add Trendline.
4. Select the Linear option from the list of trendline types.
5. In the formula bar, enter the SLOPE and INTERCEPT functions.
6. In the function arguments, enter the known_ys and known_xs.
7. Click OK.
The result of the SLOPE and INTERCEPT functions will be displayed in the formula bar. The slope of the trendline is the coefficient of the x-variable in the equation. For example, if the equation displayed on the chart is y = 2x + 1, the slope of the trendline is 2.
Related FAQ
How to Find the Slope of a Trendline in Excel?
Q1: What is a Trendline?
A trendline is a line drawn over a set of data points in a scatter plot or other graph. It shows the general direction of the data points, and can be used to make predictions about future data points by extrapolating the line.
Q2: How do I add a Trendline in Excel?
You can add a trendline to a chart in Excel by first selecting the chart and then clicking on the ‘Chart Elements’ button in the top right corner of the chart. From there, you can select ‘Trendline’ and then choose the type of trendline you want to add.
Q3: What is the formula for the Slope of a Trendline?
The formula for the slope of a trendline is y = mx + b, where m is the slope and b is the y-intercept. The slope is calculated as the change in y divided by the change in x.
Q4: How do I find the Slope of a Trendline in Excel?
You can find the slope of a trendline in Excel by first adding a trendline to a chart. Then, right-click the trendline and select ‘Format Trendline’. From the ‘Format Trendline’ window, select the ‘Options’ tab and then check the ‘Display equation on chart’ checkbox. This will display the equation of the trendline on the chart, including the slope.
Q5: How do I use the Slope of a Trendline?
The slope of a trendline can be used to make predictions about future data points by extrapolating the line. For example, if the slope of a trendline is increasing, this could indicate that the data points are increasing in value over time, and can be used to make predictions about future data points.
Q6: What is the R-squared value of a Trendline?
The R-squared value of a trendline is a measure of how well the trendline fits the data points. It is calculated as the ratio of the sum of the squared errors to the total variation in the data. The closer the R-squared value is to 1, the better the trendline fits the data points.
The slope of a trendline in Excel can be found easily and quickly with a few simple steps. With the right knowledge, you can determine the slope of the trendline and use that data to draw powerful conclusions. With Excel, you can easily find the slope of a trendline and use that to make powerful decisions. So, don’t wait, start finding the slope of your trendlines today!
How to Lock Rows in Excel When Scrolling?
How to Delete Extra Rows in Excel?
Related Posts

Small businesses struggle with ERC tax credit submissions

10 Misunderstandings of the Employee Retention Credit

ERC Tax Credit 2023: Is the ERC tax credit still available?
