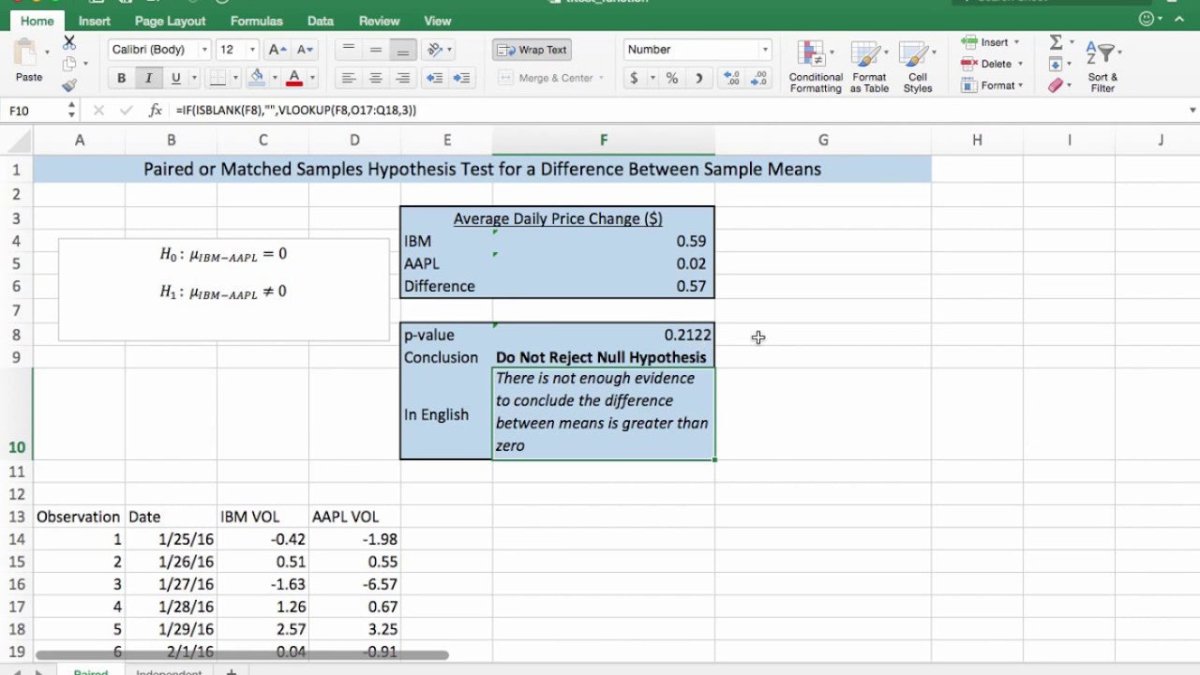
How to Use T Test in Excel?
Are you interested in understanding how to use T Test in Excel? T Test is a useful statistical tool that allows you to compare two sets of data to determine if they are significantly different. This guide will provide you with step-by-step instructions on how to use T Test in Excel, so you can take advantage of this powerful tool. With the help of this guide, you’ll be able to quickly and easily run a T Test in Excel and analyze your data. Let’s get started!
- Open a new Excel worksheet.
- Enter the data for both populations in separate columns.
- Go to the ‘Data’ tab and select the Data Analysis option.
- Choose ‘T Test: Two-Sample Assuming Equal Variances’ from the list.
- Enter the input range for both populations.
- Select the output range.
- Click ‘OK’ and the results will appear in the output range.

Related FAQ
What is a T test?
A t test is a type of inferential statistical test that is used to determine whether there is a significant difference between the means of two groups. It is commonly used in research to compare the means of two groups, such as the difference between the means of two different treatments or between the means of two samples. The t test is also used to compare the means of two populations. The t test is a parametric test, meaning that it assumes that the data follows a normal distribution.
What is the formula for the T test?
The formula for the t test is: t = (x̄1 – x̄2) / sqrt, where x̄1 and x̄2 represent the sample means, s1 and s2 represent the sample standard deviations, and n1 and n2 represent the sample sizes.
What are the assumptions of the T test?
The t test makes several assumptions about the data. These assumptions include: (1) normal distribution of the data, (2) homogeneity of variance, (3) independence of samples, (4) data is at least interval level, and (5) sample size is appropriate for the test.
What is the difference between a one-tailed and two-tailed T test?
A one-tailed t test is used to test whether the means of two groups are significantly different in one direction, while a two-tailed t test is used to test whether the means of two groups are significantly different in both directions.
How do you use T test in Excel?
In Excel, you can use the T-Test data analysis tool to perform a t test. To do so, go to the Data tab, select Data Analysis, and then select T-Test: Two-Sample Assuming Unequal Variances. You will then need to enter the data for both groups, select the Alpha level, and select the option for a two-tailed test. Once you have done so, click OK and the results of the t test will be displayed in a new window.
What does the T test results mean?
The results of the t test will show the t statistic, degrees of freedom, and the p-value. The t statistic is the test statistic used in the t test and is used to determine whether the means of the two groups are significantly different. The degrees of freedom is the number of values in the dataset that are free to vary. The p-value is the probability of getting a result as extreme as the observed t statistic if the null hypothesis is true. If the p-value is less than the alpha level, then the null hypothesis is rejected, meaning that the means of the two groups are significantly different.
Using t-tests in Excel is a great way to quickly and accurately analyze data sets. It is an important tool for any data analyst to have in their arsenal and can be used in a variety of scenarios. With the simple steps outlined in this article, you will be able to quickly and easily calculate t-tests in Excel and get the results you need. Invest the time to learn this powerful tool and you will be able to quickly and accurately analyze data sets and make informed decisions.


