
How to Use Sparklines in Excel?
If you’re a data-driven thinker and want to add a visual element to your Excel documents, then Sparklines are the perfect way to do it. Sparklines are small, simple charts that are embedded within a cell and can provide a wealth of information at a glance. In this article, we’ll discuss what Sparklines are, how to create them, and how to use them to make your Excel documents more dynamic and engaging. Get ready to add a powerful tool to your data analysis arsenal!
Sparklines are miniature charts that fit in a single cell and provide a visual representation of data in an Excel worksheet. To create Sparklines in Excel, select the data range and click on the Insert tab. Then, select Sparklines and choose the type of Sparkline you want to create. You can customize the Sparkline by changing the type, color, style, and other options. To add more data points, select the cell with the Sparkline and drag the range selection over the additional data.
- Step 1: Select the data range.
- Step 2: Go to the Insert tab and select Sparklines.
- Step 3: Choose the type of Sparkline you want to create.
- Step 4: Customize the Sparkline by changing the type, color, style, and other options.
- Step 5: To add more data points, select the cell with the Sparkline and drag the range selection over the additional data.

What Are Sparklines?
Sparklines are tiny charts that are used to visualize data in a single cell, allowing you to convey information in a more effective way. They are especially helpful when you need to compare values, spot trends, and show changes in data over time. Sparklines are available in all versions of Excel, and can be used to quickly and easily create charts that are small and easy to read.
Sparklines are often used in dashboards, where they allow you to quickly view information at a glance. They are also helpful when you need to compare data in different cells. For example, if you have a row of cells that show sales figures for different months, you can add a sparkline to each cell to quickly compare the data.
How to Create Sparklines in Excel
Creating sparklines in Excel is very easy. To get started, select the data that you want to visualize with a sparkline. Then, click on the Insert tab and select the Sparklines drop-down menu. Select the type of sparkline you would like to create (line, column, or win/loss).
Once you have selected the type of sparkline you want to create, you can customize the look of the sparkline. You can change the color and line style, add a data marker, and more. You can also add a sparkline title to help explain what the sparkline is showing.
How to Format Sparklines in Excel
Once you have inserted a sparkline into a cell, you can format it to better display your data. To format a sparkline, click on the cell containing the sparkline and select the Design tab in the Sparklines group.
From the Design tab, you can change the type of sparkline (line, column, or win/loss). You can also customize the color and style of the line and add a data marker. You can also add a sparkline title to help explain what the sparkline is showing.
How to Modify Sparkline Data in Excel
If you need to modify the data used in a sparkline, you can easily do so. To modify the data used in a sparkline, click on the cell containing the sparkline and select the Edit Data button in the Sparklines group.
In the Edit Data window, you can add or remove data points, change the order of the data points, or change the data source. Once you have made your changes, click OK to save your changes.
How to Remove Sparklines in Excel
If you no longer need a sparkline, you can easily remove it from your worksheet. To remove a sparkline, select the cell containing the sparkline and select the Clear button in the Sparklines group.
Once you have cleared the sparkline, you can also remove any associated labels or titles. To do this, select the cell containing the label or title and press the Delete key.
Top 6 Frequently Asked Questions
What Are Sparklines in Excel?
Answer: Sparklines in Excel are small, compact charts that are used to provide a visual representation of data. Sparklines are used to display trends in data in a very small space such as in a single cell. They are used to quickly identify patterns in data and can be customized to provide the user with different visualizations of the data. Sparklines can be used to compare data sets, identify trends, and quickly highlight important values.
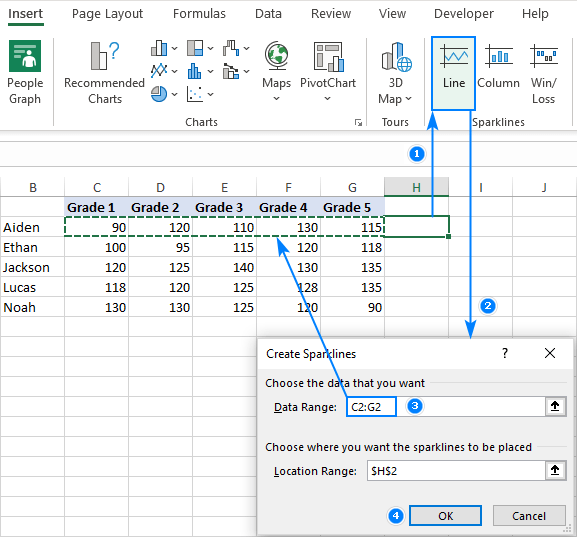
How Do You Create a Sparkline in Excel?
Answer: To create a sparkline in Excel, select the cells that contain the data that you want to visualize. Then, click the Insert tab, and then click either the Line, Column, or Win/Loss options from the Sparklines group. This will bring up the Create Sparklines window, where you will select the data range to be used and the cell where the sparkline will be inserted. Once the data is selected, click OK to insert the sparkline into the cell.
How Do You Change the Appearance of a Sparkline?
Answer: To change the appearance of a sparkline in Excel, right-click on the sparkline, and select the “Sparkline Color” option. This will open the “Format Sparkline” window, where you can customize the sparkline’s color, line thickness, and marker size. You can also choose to add a data marker to the sparkline, which will display the exact data value when you hover over it.
Can Sparklines be Used to Compare Data Sets?
Answer: Yes, sparklines can be used to compare data sets. When comparing data sets, it is important to ensure that the data points are aligned. To do this, select the data range of both data sets, and then click the Insert tab. Then, click the “Compare Data” option from the Sparklines group. This will create separate sparklines for each data set, and align the data points so that they can be compared.
How Do You Add a Sparkline to a Chart in Excel?
Answer: To add a sparkline to a chart in Excel, select the chart and then click the Insert tab. Then, click the “Sparkline” option from the Sparklines group. This will open the “Create Sparkline” window, where you will select the data range to be used and the cell where the sparkline will be inserted. Once the data is selected, click OK to insert the sparkline into the chart.
Can Sparklines be Used to Analyze Big Data?
Answer: Yes, sparklines can be used to analyze big data. Sparklines are a great way to quickly identify patterns in data and can be used to quickly identify outliers, trends, and correlations. Sparklines can also be used to compare data sets and highlight important values. However, when analyzing large data sets, it is important to ensure that the data is properly aligned.
Sparklines are a great tool to visualize data in Excel. They are easy to create, read and understand. With them, you can quickly get a snapshot of your data, highlight trends, and compare values quickly and easily. Whether you’re a beginner or an advanced user, sparklines are a great way to bring your data to life. So, go ahead and give sparklines a try!
How to Find Average on Excel?
How to Insert a Clustered Column Chart in Excel?
Related Posts

Small businesses struggle with ERC tax credit submissions

10 Misunderstandings of the Employee Retention Credit

ERC Tax Credit 2023: Is the ERC tax credit still available?
