
How to Find Standard Error of the Mean in Excel?
Are you trying to find the standard error of the mean in Excel but not sure of the process? If so, you’ve come to the right place. In this article, we’ll provide a step-by-step guide on how to calculate standard error of the mean in Excel. We’ll explain how to access the formula, how to use it correctly, and what the results mean. By the end of this article, you’ll have all the tools necessary to calculate standard error of the mean in Excel. So, let’s get started!
To find the standard error of the mean in Excel, use the STDEV.S function:
1. Enter the data you wish to analyze into a column.
2. Select the cell below the bottom of your data column.
3. Enter the formula =STDEV.S(, followed by the range of cells containing the data (e.g. A2:A15) and a closing parenthesis.
4. Press Enter to calculate the standard error of the mean.

Understanding Standard Error of the Mean in Excel
Standard Error of the Mean (SEM) is a measure of how accurately the sample mean represents the true population mean. It is a measure of the variability of the sample mean. In Excel, this can be calculated using the STDEV.P() and AVERAGE() functions. This article will discuss how to find the Standard Error of the Mean in Excel and the importance of the SEM in data analysis.
Calculating Standard Error of the Mean in Excel
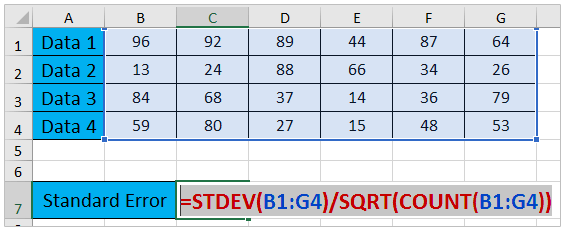
The Standard Error of the Mean can be calculated in Excel using the STDEV.P() and AVERAGE() functions. The STDEV.P() function calculates the population standard deviation, while the AVERAGE() function calculates the mean of the data. To calculate the SEM in Excel, the formula is “=STDEV.P(data)/SQRT(COUNT(data))”, where “data” is the data set to be analyzed. This formula is entered into a cell in an Excel spreadsheet and the Standard Error of the Mean will be calculated.
Interpreting the Standard Error of the Mean
The Standard Error of the Mean can be used to interpret the accuracy of the sample mean. A low standard error of the mean indicates that the sample mean is a good representation of the true population mean, while a high standard error of the mean indicates that the sample mean is not a good representation of the true population mean. The SEM should be used in conjunction with other measures of variability, such as the standard deviation, to further interpret the data.
Importance of Standard Error of the Mean
The Standard Error of the Mean is an important measure of variability in data analysis. It can be used to accurately interpret the accuracy of the sample mean and to compare sample means from different data sets. Understanding the SEM is essential for accurately interpreting data and drawing meaningful conclusions from data analysis.
Example of Standard Error of the Mean
The following example will illustrate how to calculate the Standard Error of the Mean in Excel. Consider a data set of 10 values, with a mean of 5. The Standard Error of the Mean can be calculated by entering the formula “=STDEV.P(data)/SQRT(COUNT(data))” into a cell in an Excel spreadsheet. In this example, the result will be 0.70710678118, indicating that the sample mean is not a good representation of the true population mean.
Conclusion
The Standard Error of the Mean is an important measure of variability in data analysis. It can be used to accurately interpret the accuracy of the sample mean and to compare sample means from different data sets. Understanding how to calculate the SEM in Excel is essential for accurately interpreting data and drawing meaningful conclusions from data analysis.
Few Frequently Asked Questions
What is Standard Error of the Mean?
Standard Error of the Mean (SEM) is an estimation of the variability of a population or sample mean. It is calculated by dividing the standard deviation of a sample by the square root of the sample size. This helps to provide a measure of the precision of the mean.
What is the Formula for Calculating Standard Error of the Mean?
The formula for calculating Standard Error of the Mean is: SEM = SD / √n, where SD is the standard deviation of the sample and n is the sample size.
How to Find Standard Error of the Mean in Excel?
There are multiple ways to calculate the Standard Error of the Mean in Excel. One way is to use the STDEV.P function, which calculates the sample standard deviation of a given dataset. You can then divide this by the square root of the sample size (n) to calculate the SEM. Another way is to use the CONFIDENCE function, which gives the confidence interval of a dataset. You can then calculate the SEM by taking the difference between the upper and lower bounds of the confidence interval and dividing by 2.
What is the Difference Between Standard Error of the Mean and Standard Deviation?
Standard Error of the Mean (SEM) is an estimation of the variability of a population or sample mean, while Standard Deviation (SD) is an estimation of the variability of a population or sample. SEM is calculated by dividing the SD of a sample by the square root of the sample size, while SD is calculated by calculating the square root of the variance of the sample.
What is the Use of Standard Error of the Mean?
Standard Error of the Mean (SEM) is a measure of the precision of a given sample mean. It provides a measure of how close the sample mean is expected to be to the true population mean. It is also used to compare the variability of two different samples, as the SEM can be used to calculate the confidence interval of a sample, which can then be used to compare two or more samples.
How Can Standard Error of the Mean be Reduced?
The Standard Error of the Mean (SEM) can be reduced by increasing the sample size. This is because the SEM is inversely proportional to the square root of the sample size, so by increasing the sample size, the SEM will be reduced. Additionally, the SEM can be reduced by ensuring that the sample is representative of the population. By ensuring that the sample is representative, it will reduce the amount of variability in the sample.
Standard Error of the Mean in Excel
In conclusion, finding the standard error of the mean in Excel is an easy and straightforward process. With a few clicks of the mouse and a basic understanding of the formula, you can quickly calculate the standard error of the mean in Excel and use the data to make informed decisions. With the help of this tutorial, you should now have a better understanding of how to find standard error of the mean in Excel and the importance of the data it provides.
Related Posts

Small businesses struggle with ERC tax credit submissions

10 Misunderstandings of the Employee Retention Credit

ERC Tax Credit 2023: Is the ERC tax credit still available?
