
How to Calculate Error Bars in Excel?
Are you looking for an easy way to calculate error bars in Excel? If so, you’re in luck! In this article, we will provide a step-by-step guide to help you calculate error bars in Excel quickly and easily. We’ll cover the basics of what error bars are, how to interpret them and the formulas used to calculate them. We’ll also provide some tips and tricks to make the process simpler and more efficient. So, grab your mouse and let’s get started!
Error bars in Excel are used to represent the variability in data and illustrate the errors on the graph. To calculate error bars in Excel, simply follow these steps:
- Open the spreadsheet containing the data.
- Select the data series and the associated error bars you wish to graph.
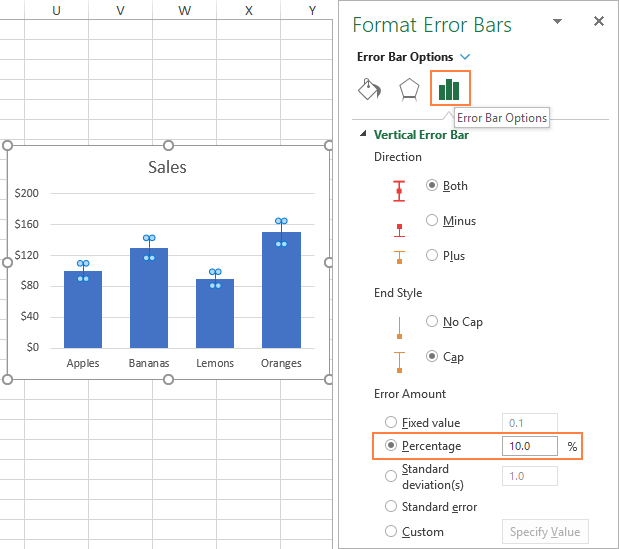
- Go to the ‘Chart Tools’ tab and select ‘Error Bars’ and then ‘More Error Bars Options’.
- In the Format Error Bars dialog box, select the ‘Display and Error Amount’ option.
- Choose the ‘Fixed Value’ option and enter the desired value into the ‘Positive Error Value’ field.
- Repeat the same steps for the negative error bars.
- Click ‘OK’ and the error bars will appear in the graph.

Understanding Error Bars in Excel
Error bars are graphical representations of the variability of data and are used on graphs to indicate the error or uncertainty in a reported measurement. Error bars provide a visual indication of the variation of the data within a series. In Excel, error bars can be added to a chart to indicate the range of values that fall within a certain confidence interval. This helps to give a better understanding of the data and its distribution.
Error bars are used to show the uncertainty associated with a particular measurement. They are used to compare different data sets, to draw attention to important features of the data, and to provide visual indications of the uncertainty in the data. By adding error bars to a chart, it can help to better understand the underlying data.
What are the Different Types of Error Bars?
There are three types of error bars available in Excel: standard error bars, percentage error bars, and standard deviation error bars. Standard error bars show the standard deviation of the data set. Percentage error bars show the percentage of the data set that falls within a certain range. Standard deviation error bars show the standard deviation of the data set.
Standard error bars are a useful tool for displaying the variation in data. They can be used to compare multiple data sets and identify trends. However, they do not provide any information about the uncertainty of a particular measurement.
Percentage error bars are a more accurate way of displaying the uncertainty of a measurement. They display the percentage of the data set that falls within a certain range. This helps to give a better understanding of the data and allows for more accurate comparison of data sets.
Standard deviation error bars are a useful way of displaying the variability of data. They display the standard deviation of the data set. This helps to give a better understanding of the data and its variability.
How to Calculate Error Bars in Excel?
In order to calculate error bars in Excel, first select the data that will be used to calculate the error bars. This can be done by selecting the range of data in the worksheet. Once the data is selected, click the ‘Insert’ tab, then select ‘Error Bars’ from the Chart Tools menu.
Next, select the type of error bars that will be used. This can be done by selecting either ‘Standard Error Bars’, ‘Percentage Error Bars’, or ‘Standard Deviation Error Bars’. Once the type of error bars is selected, click ‘OK’ to finish the selection.
The error bars will now be calculated based on the data selected. The error bars will be displayed on the chart. If the error bars are not correct, they can be adjusted by selecting ‘Error Bars Options’ from the Chart Tools menu, and adjusting the parameters.
Tips for Using Error Bars in Excel
When using error bars in Excel, it is important to ensure that they are used correctly. It is important to understand the different types of error bars and select the one that best represents the data. Additionally, it is important to ensure that the error bars are correctly calculated and displayed.
It is also important to check that the error bars are consistent with the data. For example, if the data is normally distributed, then the error bars should also be normally distributed. Additionally, it is important to ensure that the error bars are visually consistent with the data.
Using Error Bars to Analyze Data
Error bars can be used to help analyze data and identify trends. They can be used to compare multiple data sets and help to draw attention to important features of the data. Additionally, they can be used to identify the uncertainty of a particular measurement.
Error bars can also be used to give a better understanding of the underlying data. By visually comparing the error bars to the data, it can help to identify any outliers or inconsistencies in the data. Additionally, it can help to identify any trends or patterns in the data.
Conclusion
Error bars are an important tool for displaying the variability of data. They can be used to compare multiple data sets, identify trends, and draw attention to important features of the data. Additionally, they can be used to help analyze data and identify the uncertainty of a particular measurement. In Excel, error bars can be added to a chart to indicate the range of values that fall within a certain confidence interval.
Few Frequently Asked Questions
What are error bars in Excel?
Error bars in Excel are graphical indicators of data variability. They are vertical or horizontal lines drawn on a chart to represent a range of values that are expected to occur. This range is usually determined by the standard deviation of the data points, which is a measure of how widely spread out the data points are. Error bars help to show the variability and uncertainty in data points, and they can be used to compare different data sets or to check the validity of conclusions drawn from the data.
What are the different types of error bars in Excel?
There are three types of error bars in Excel: standard error bars, fixed value error bars, and percentage error bars. Standard error bars show the standard deviation of the data points and are calculated automatically by Excel. Fixed value error bars are used to set a specific value for all data points in the graph. Percentage error bars use a percentage of the data points to determine the range of values.
How do you calculate error bars in Excel?
To calculate error bars in Excel, first select the range of data points in the chart. Then click the “Layout” tab in the Ribbon and click the “Error Bars” button. Select the type of error bars you want to use (standard, fixed value, or percentage). Finally, enter the values for the standard deviation, fixed value, or percentage to be used in the calculation. Excel will automatically calculate the error bars for the selected range of data points.
How do you customize error bars in Excel?
Error bars in Excel can be customized in several ways. You can change the color, line style, and size of the error bars, as well as the display of the error bars (e.g., if you want to display only the upper and lower error bars, or all four). To customize an error bar, select the data points and click the “Format” tab in the Ribbon. In the “Error Bars” section, select the options you want to use for the error bars.
What is the purpose of error bars in Excel?
The purpose of error bars in Excel is to provide a visual indication of the variability and uncertainty in a set of data points. Error bars can be used to compare different data sets, or to check the validity of conclusions drawn from the data. They can also be used to help determine trends in the data.
What are the advantages of using error bars in Excel?
Error bars in Excel provide a quick and easy way to visually display the variability and uncertainty in data points. They are also a useful tool for comparing different data sets and helping to identify trends in the data. Additionally, error bars are helpful for checking the validity of conclusions drawn from the data.
How To Add Error Bars In Excel Scatter Plot (Custom Error Bars)
Error bars in Excel are a great way to quickly visualize the variance in a data set. By taking the time to learn how to calculate error bars in Excel, you can save yourself time and energy in the long run. With the right knowledge, you can take your data analysis to the next level and get a better understanding of your data. With error bars, you can effectively visualize the variance of your data set and make better decisions.
How to Run Fast in Fortnite Xbox?
How to Redeem Xbox Digital Code From Amazon?
Related Posts

Small businesses struggle with ERC tax credit submissions

10 Misunderstandings of the Employee Retention Credit

ERC Tax Credit 2023: Is the ERC tax credit still available?
