How to Connect Google Analytics to Power Bi?
Are you looking for ways to use the data from Google Analytics to create detailed reports and visualizations in Power BI? Connecting these two powerful tools can help you gain valuable insights into your website’s performance, allowing you to make better decisions for your business. In this article, we’ll show you how to easily connect Google Analytics to Power BI so you can start analyzing your data.
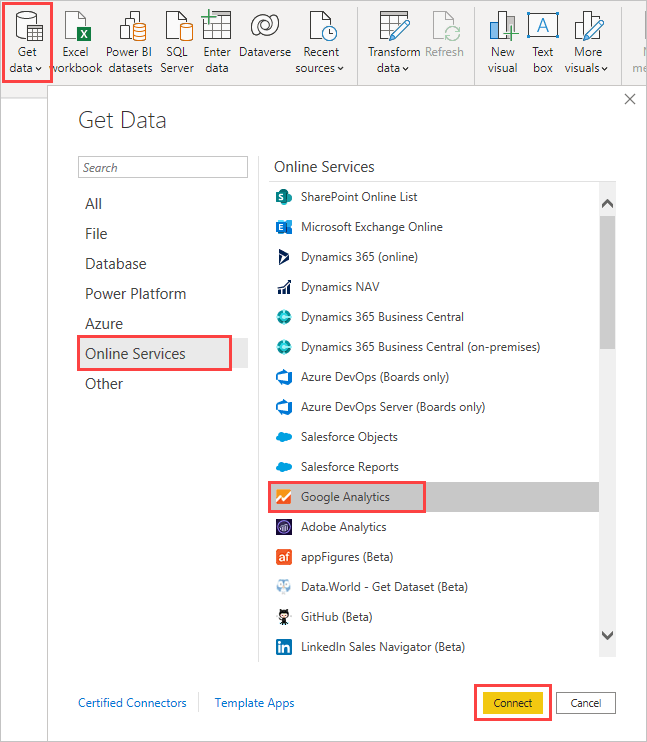
- Open Power BI and click the Get Data button.
- Select Google Analytics from the list of services.
- Log in to your Google Account, then select the Google Analytics account, property and view.
- Click Connect to import the data.
- You can also select from the list of data to be imported.
- Once the data is imported, you can now start creating reports and visualisations.

Connecting Google Analytics to Power BI for Data Visualization
Google Analytics and Power BI are two powerful tools that can help you collect and visualize data from your website. Google Analytics offers deep insights into website traffic, while Power BI gives you the ability to create stunning visualizations with your data. By connecting Google Analytics to Power BI, you can get a better understanding of your website visitors and create engaging visuals to share with your team. In this article, we will explore how to connect Google Analytics to Power BI.
Google Analytics is a powerful tool that can provide you with detailed insights into your website traffic. It can track user behavior, page visits, and visitor demographics, as well as other important metrics. With Google Analytics, you can get a better understanding of who is visiting your website and what they are doing while they are there.
Power BI is a business intelligence solution that can help you create engaging visuals with your data. It has a wide range of features, such as data analysis, interactive visuals, and reports. With Power BI, you can create stunning visuals to share with your team and get a better understanding of your data.
Step 1: Connect Google Analytics to Power BI
The first step to connecting Google Analytics to Power BI is to sign up for a Power BI account. You can sign up for a free account or choose one of the paid plans. Once you have signed up for an account, you can connect Google Analytics to Power BI. To do this, first go to the Power BI dashboard and click “Settings” in the top right corner. Then, click “Data Sources” and select “Google Analytics.”
Next, you will need to enter your Google Analytics credentials. You will also need to select the account, property, and view that you want to connect to Power BI. Once you have entered all of the information, click “Connect.” Power BI will then start to pull data from Google Analytics.
Step 2: Set Up the Power BI Dashboard
After you have connected Google Analytics to Power BI, you can begin to create your Power BI dashboard. You can customize your dashboard to include the data that you want to analyze. This can be anything from page visits to user demographics.
To begin creating your dashboard, click “Dashboards” in the top right corner of the Power BI dashboard. Then, click “Create New Dashboard” and select the data that you want to include. You can customize your dashboard with charts, graphs, and other visuals.
Step 3: Analyzing and Visualizing the Data
Once you have set up your Power BI dashboard, you can begin to analyze and visualize the data from Google Analytics. You can use the charts and graphs to get a better understanding of your website traffic. You can also use the data to identify trends and gain insights into your visitors.
Step 4: Sharing Your Dashboard
Once you have analyzed and visualized the data from Google Analytics, you can share your dashboard with your team. You can do this by clicking “Share” in the top right corner of the Power BI dashboard. You can then enter the email addresses of the people you want to share your dashboard with.
Step 5: Scheduling Reports
Finally, you can set up scheduled reports to keep track of your data. You can do this by clicking “Schedule Reports” in the top right corner of the Power BI dashboard. You can then select the frequency and format of your report, as well as the data that you want to include. Scheduling reports can help you stay up to date with your website traffic and identify any changes over time.
Frequently Asked Questions
What is Google Analytics?
Google Analytics is a web analytics service offered by Google that tracks and reports website traffic. It is the most widely used web analytics service on the web. It provides valuable insights into how people find and use your website, allowing you to make informed decisions about your online presence. It offers a variety of features, such as tracking user behavior, page views, and more.
What is Power BI?
Power BI is a business analytics service provided by Microsoft. It enables users to visualize and analyze data with greater speed, efficiency, and understanding. Power BI provides powerful data analysis, data visualization, and artificial intelligence capabilities, all in one unified platform. It allows users to create interactive dashboards and reports that can be shared across the organization.
How to Connect Google Analytics to Power BI?
Connecting Google Analytics to Power BI is a simple process. First, you will need to configure the Google Analytics connector within Power BI. This can be done by selecting the ‘Get Data’ option in the Power BI ribbon, selecting ‘More’ and then selecting ‘Google Analytics’. Once this is done, you will be prompted to enter your Google Analytics credentials. After entering your credentials, you can then choose the data to be imported from Google Analytics. Finally, you can create a report or a dashboard using the imported data.
What Data Can be Pulled from Google Analytics?
Google Analytics provides a wealth of data to help you understand your website traffic. This includes data on user behavior, page views, referral sources, and more. Additionally, Google Analytics provides data on audience demographics, such as age, gender, and location. This data can help you to better understand the people who visit your website and determine how to better serve their needs.
What are the Benefits of Connecting Google Analytics to Power BI?
Connecting Google Analytics to Power BI offers a variety of benefits. By connecting the two services, users can easily visualize and analyze their website data to gain valuable insights. Additionally, users can easily create interactive dashboards and reports to share with colleagues. Furthermore, Power BI can be used to create predictive models and forecasts to help you better anticipate customer needs.
Are there any Limitations to Connecting Google Analytics to Power BI?
Yes, there are some limitations to connecting Google Analytics to Power BI. For instance, Power BI does not support all of the features offered by Google Analytics, such as event tracking and custom segments. Additionally, data pulled from Google Analytics is limited to the last 30 days, and certain metrics, such as page views, are only available for up to 90 days. Finally, real-time data is not available through Google Analytics.
Connecting Power Bi with Google Analytics | Power Bi Dashboard| Learn Power Bi
Connecting Google Analytics to Power BI is a great way to gain deeper insights into the performance of your website or app. By utilizing the power of Google Analytics and Power BI, you can gain a comprehensive understanding of your website’s performance, allowing you to make better decisions that will ultimately lead to increased traffic and higher conversion rates. With the right data and analysis, you can use this powerful combination to take your business to the next level.
What is Power Bi Used for?
How to Connect Netsuite to Power Bi?
Related Posts
Switch Careers with Power BI Career: Your Path to Success
How to Export Power Bi Report to Excel?
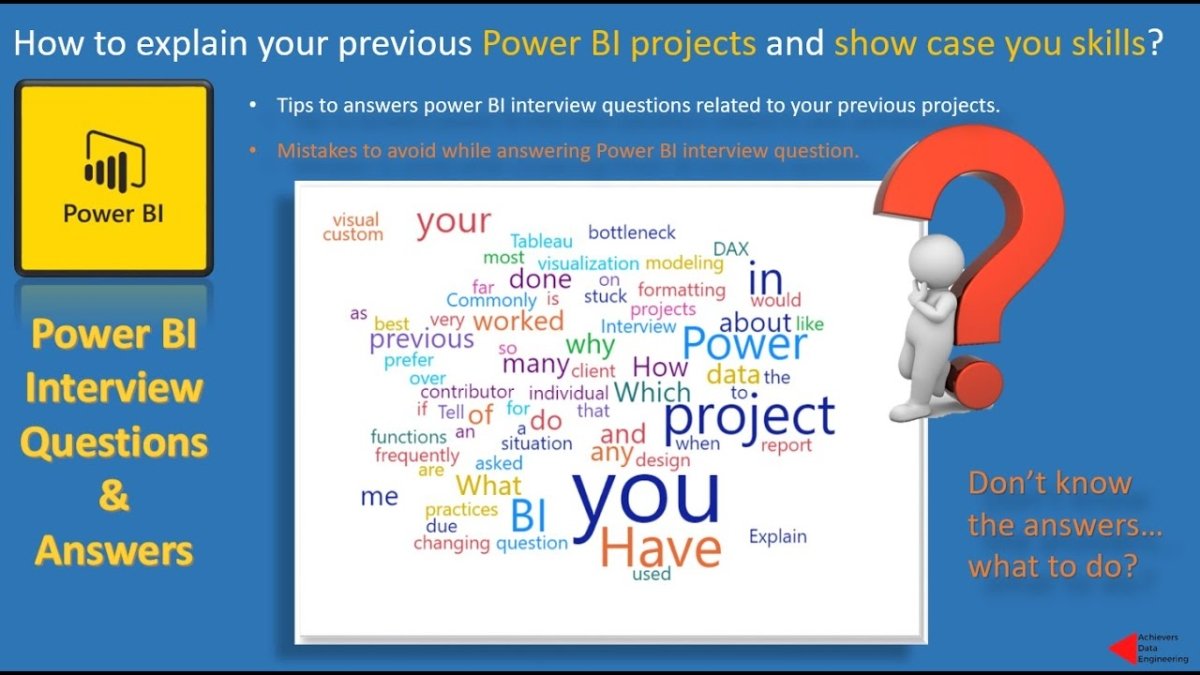
How to Explain Power Bi Project in Interview?
How to Enable Power Bi in Office 365?