
How to Do Probability in Excel?
Do you need to know how to do probability in Excel, but don’t know where to start? Learning how to use the powerful features of Excel to solve probability problems can be intimidating, but it doesn’t have to be. In this guide, we’ll provide a comprehensive overview of Excel’s probability tools, from calculating simple probabilities to creating probability distributions and more. With the help of this guide, you’ll be able to confidently use Excel to quickly and accurately solve probability problems. So let’s get started!
How to Do Probability in Excel?
You can do probability calculations in Excel using the Data Analysis toolpak. First, open your Excel workbook and select the Data tab. Click Data Analysis, and then choose the type of probability calculation you want to do from the list. You’ll need to provide your data in a range of cells. When you’re finished, you’ll get a report with your probability calculation. You can also use the IF function to calculate probability in Excel. This function allows you to enter a set of conditions and returns a value if those conditions are met.

Introduction to Probability in Excel
Probability is the likelihood of an event to occur. It is a crucial concept for data analysis and decision making. Excel has powerful functions and features to calculate probability. This article will explain how to do probability in Excel.
Calculating Probability in Excel
Calculating probability in Excel is easy. Excel has built-in functions to calculate probability. The most commonly used functions are BINOMDIST, CHISQ.DIST, NORMDIST, and POISSON.DIST. To calculate probability, you need to provide the function with the required parameters.
For example, to calculate the probability of getting two heads in four coin flips, you can use the BINOMDIST function. The syntax is BINOMDIST(number of successes, number of trials, probability of success, cumulative). The parameters in this example are number of successes = 2, number of trials = 4, probability of success = 0.5, and cumulative = FALSE.
Calculating Cumulative Probability in Excel
The BINOMDIST function can also be used to calculate cumulative probability. In this case, the cumulative parameter is set to TRUE. This will calculate the probability of getting the specified number of successes or fewer.
For example, to calculate the probability of getting two heads or fewer in four coin flips, the parameters would be number of successes = 2, number of trials = 4, probability of success = 0.5, and cumulative = TRUE.
Using CHISQ.DIST Function to Calculate Probability
The CHISQ.DIST function is used to calculate the probability of a chi-square statistic. This function takes three parameters: the chi-square statistic, the degrees of freedom, and the cumulative parameter.
For example, to calculate the probability of a chi-square statistic of 7 with 3 degrees of freedom, the parameters would be chi-square statistic = 7, degrees of freedom = 3, and cumulative = FALSE.
Using NORMDIST Function to Calculate Probability
The NORMDIST function is used to calculate the probability of a normal (or Gaussian) distribution. This function takes four parameters: the mean, the standard deviation, the lower limit, and the upper limit.
For example, to calculate the probability of a normal distribution with a mean of 0 and a standard deviation of 1, the parameters would be mean = 0, standard deviation = 1, lower limit = 0, and upper limit = 1.
Using POISSON.DIST Function to Calculate Probability
The POISSON.DIST function is used to calculate the probability of a Poisson distribution. This function takes two parameters: the mean and the number of successes.
For example, to calculate the probability of a Poisson distribution with a mean of 5, the parameters would be mean = 5 and number of successes = 5.
Conclusion
Excel has powerful functions and features to calculate probability. This article has explained how to do probability in Excel using the BINOMDIST, CHISQ.DIST, NORMDIST, and POISSON.DIST functions. With these functions, you can calculate the probability of events with different distributions.
Top 6 Frequently Asked Questions
Question 1: What is probability in Excel?
Answer: Probability in Excel is a way to calculate the probability of an event occurring in Excel using the built-in functions. Probability is a measure of the likelihood of an event occurring, and Excel provides several functions that allow users to calculate the probability of an event occurring. These functions can be used to calculate the probability of a single event, multiple events, or a combination of events. For example, a user can calculate the probability of winning a lottery based on the odds given. Additionally, users can calculate the probability of two or more events occurring at the same time, such as the probability of rolling a certain number on a die or the probability of getting a certain color from a deck of cards.
Question 2: What is the syntax for a probability function in Excel?
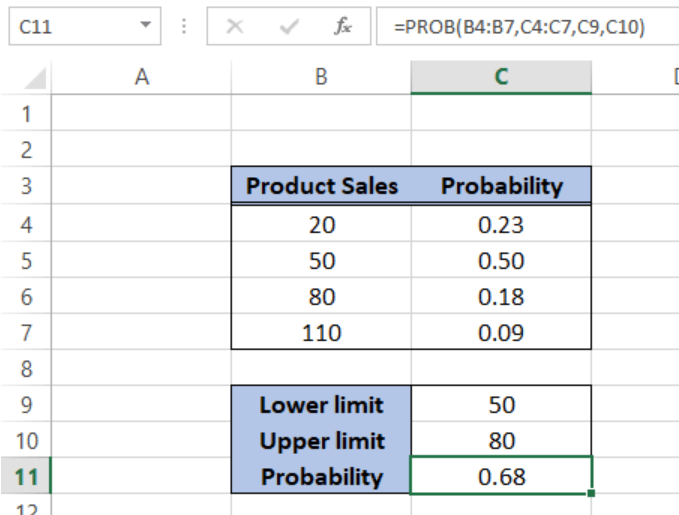
Answer: The syntax for a probability function in Excel is as follows: PROBABILITY(x, mean, standard_dev). The “x” represents the value for which you are calculating the probability, the “mean” is the average value of the data set, and the “standard_dev” is the standard deviation of the data set. Each of these parameters must be specified in order to correctly calculate the probability.
Question 3: How do I calculate the probability of a single event in Excel?
Answer: To calculate the probability of a single event in Excel, you will need to use the PROBABILITY function. This function requires three parameters: the value of the event in question (x), the mean of the data set (mean), and the standard deviation of the data set (standard_dev). Once you have entered the parameters into the function, the result will be the probability of the event occurring.
Question 4: How do I calculate the probability of multiple events occurring in Excel?
Answer: To calculate the probability of multiple events occurring in Excel, you will need to use the MULTINOMIAL function. This function takes three parameters: the values of the events in question (x1, x2, x3, etc.), the mean of the data set (mean), and the standard deviation of the data set (standard_dev). Once you have entered the parameters into the function, the result will be the probability of all of the events occurring.
Question 5: How do I calculate the probability of two or more events occurring at the same time in Excel?
Answer: To calculate the probability of two or more events occurring at the same time in Excel, you will need to use the COMBIN function. This function takes two parameters: the number of events (n) and the number of outcomes (k). Once you have entered the parameters into the function, the result will be the probability of the two or more events occurring at the same time.
Question 6: How do I calculate the probability of multiple events occurring in a specific order in Excel?
Answer: To calculate the probability of multiple events occurring in a specific order in Excel, you will need to use the PERMUT function. This function takes two parameters: the number of events (n) and the number of outcomes (k). Once you have entered the parameters into the function, the result will be the probability of the multiple events occurring in the specified order.
As you can see, understanding how to do probability in Excel is a great way to be able to quickly and accurately calculate the probability of different events. With the help of this guide, you should now have a basic understanding of how to go about setting up and running probability calculations in Excel. With a little practice, you should soon be able to make quick and accurate calculations of probabilities with ease.
How to Make Categories in Excel?
How to Get the Standard Deviation in Excel?
Related Posts

Small businesses struggle with ERC tax credit submissions

10 Misunderstandings of the Employee Retention Credit

ERC Tax Credit 2023: Is the ERC tax credit still available?
