
How to Create Error Bars in Excel?
If you have ever tried to create a graph with data points in Excel, chances are you have seen error bars. Error bars are a useful way to visualize the uncertainty associated with your data, and allow you to make comparisons between data points. This tutorial will show you how to create error bars in Excel quickly and effectively, so you can confidently interpret your data. So let’s get started!
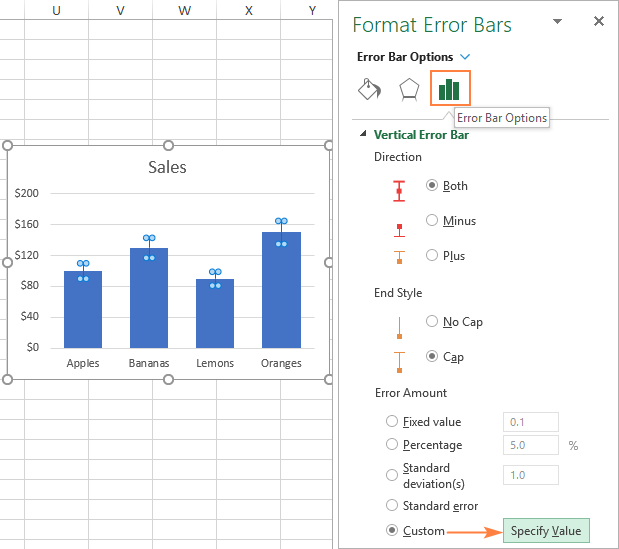
Alternatively, you can use the ‘Chart Elements’ menu to add error bars. Select the chart, click ‘Chart Elements’, and choose ‘Error Bars’. Select the type, direction, and other options, and click ‘OK’ to finish.
Step-by-step Tutorial:
- Select your data
- Click the ‘Layout’ tab and select ‘Error Bars’
- Choose the type of error bars and the direction
- Customize the values and click ‘OK’ to finish
- Or use the ‘Chart Elements’ menu to add error bars
- Select the chart, click ‘Chart Elements’, and choose ‘Error Bars’
- Select the type, direction, and other options, and click ‘OK’ to finish

Introduction to Working with Error Bars in Excel
Error Bars are graphical representations of the data in a chart or graph. They are used to indicate the variation or uncertainty in the data. Error Bars can be used in many different types of charts, including line charts, column charts, and scatter plots. Excel makes it easy to create Error Bars in your charts. In this article, we will discuss how to create Error Bars in Excel and how to use them to compare the data.
Steps to Create Error Bars in Excel
Creating Error Bars in Excel is a straightforward process. First, select the chart or graph that you want to add Error Bars to. Then, select the “Chart Tools” tab at the top of the Excel window. From there, select the “Layout” tab. This will open a menu of chart elements that you can add to your chart.
Next, select the “Error Bars” option from the list of chart elements. This will open the Error Bars dialog box. Here, you can select the type of Error Bars that you want to add to your chart. You can choose from “Standard Error”, “Percentage”, “Fixed Value”, or “Custom Value”. Depending on the type of Error Bars you select, you will be given different options to customize the Error Bars.
Standard Error
If you select the “Standard Error” option, you will be able to choose the width of the Error Bars. You can select from “Thin”, “Medium”, or “Thick”. You can also choose the direction of the Error Bars, either “Up/Down” or “Left/Right”.
Percentage
The “Percentage” option allows you to specify the percentage of the Error Bars. For example, you can enter “5%” to indicate that the Error Bars should be 5% of the data point. You can also choose the direction of the Error Bars, either “Up/Down” or “Left/Right”.
Fixed Value
The “Fixed Value” option allows you to specify a fixed value for the Error Bars. This is useful if you want to compare the data points at a specific level. You can also choose the direction of the Error Bars, either “Up/Down” or “Left/Right”.
Custom Value
The “Custom Value” option allows you to specify a custom value for the Error Bars. This is useful if you want to compare the data points at a specific level. You can also choose the direction of the Error Bars, either “Up/Down” or “Left/Right”.
Formatting Error Bars in Excel
Once you have created the Error Bars in your chart, you may want to customize their appearance. To do this, select the “Format” tab in the Error Bars dialog box. Here, you can change the color, line style, and line width of the Error Bars.
Color
The “Color” option allows you to choose the color of the Error Bars. You can select any color from the list of available colors.
Line Style
The “Line Style” option allows you to choose the style of the Error Bars. You can select from “Solid”, “Dashed”, or “Dotted”.
Line Width
The “Line Width” option allows you to choose the width of the Error Bars. You can select from “Thin”, “Medium”, or “Thick”.
Few Frequently Asked Questions
Q1. What are Error Bars in Excel?
Answer: Error Bars in Excel are used to indicate the level of uncertainty associated with a data point or data series in a chart. They are often used to represent the standard deviation or standard error of a data point, or to show the uncertainty of an estimate. Error Bars can also be used to compare the means of different data points, or to compare the frequency of different data points. Error Bars can also be used to compare multiple data points against a target value.
Q2. How are Error Bars created in Excel?
Answer: Error Bars are created in Excel by selecting the data series that you would like to add Error Bars to, then clicking on the “Chart Tools” tab and selecting the “Layout” tab. Under the “Error Bars” option, select the type of Error Bars you would like to add, such as “Standard Error”, “Standard Deviation”, or “Custom”. If you choose the “Custom” option, you can enter a range of values to be used as Error Bars. Once you have chosen the type of Error Bars, you can customize the color, line style, and pattern.
Q3. What are the different types of Error Bars in Excel?
Answer: There are several different types of Error Bars in Excel, including “Standard Error”, “Standard Deviation”, “Percentage”, and “Custom”. The “Standard Error” option allows you to show the uncertainty of a data point or data series with a standard error. The “Standard Deviation” option allows you to show the uncertainty of a data point or data series with a standard deviation. The “Percentage” option allows you to show the uncertainty of a data point or data series with a percentage. The “Custom” option allows you to enter a range of values to be used as Error Bars.
Q4. What is the purpose of Error Bars in Excel?
Answer: The purpose of Error Bars in Excel is to indicate the level of uncertainty associated with a data point or data series in a chart. Error Bars are often used to represent the standard deviation or standard error of a data point, or to show the uncertainty of an estimate. Error Bars can also be used to compare the means of different data points, or to compare the frequency of different data points. Error Bars can also be used to compare multiple data points against a target value.
Q5. How can Error Bars be used to compare data in Excel?
Answer: Error Bars can be used to compare the means of different data points, or to compare the frequency of different data points. Error Bars can also be used to compare multiple data points against a target value. To compare data using Error Bars, select the data series that you would like to compare, then click on the “Chart Tools” tab and select the “Layout” tab. Under the “Error Bars” option, select the type of Error Bars you would like to add, such as “Standard Error”, “Standard Deviation”, or “Custom”. Once you have chosen the type of Error Bars, you can customize the color, line style, and pattern.
Q6. How can Error Bars be customized in Excel?
Answer: Error Bars in Excel can be customized by selecting the data series that you would like to customize, then clicking on the “Chart Tools” tab and selecting the “Layout” tab. Under the “Error Bars” option, select the type of Error Bars you would like to customize, such as “Standard Error”, “Standard Deviation”, or “Custom”. Once you have chosen the type of Error Bars, you can customize the color, line style, and pattern. You can also customize the display of the Error Bars by setting a minimum and maximum value, or by setting the scale of the Error Bars.
How To Add Error Bars In Excel (Custom Error Bars)
Error bars are a helpful visual aid that can provide additional insights into your data. With a few quick steps, you can create error bars in Excel to display standard errors, ranges, confidence intervals, and more. With these tips and tricks, you’ll be able to quickly create error bars in Excel to easily visualize and interpret your data.
How to Port Forward Xbox One?
How to Find Standard Error of the Mean in Excel?
Related Posts

Small businesses struggle with ERC tax credit submissions

10 Misunderstandings of the Employee Retention Credit

ERC Tax Credit 2023: Is the ERC tax credit still available?
