
How to Analyze Survey Data in Excel?
Survey data can be used to collect valuable insights into customer behavior, preferences, and opinions. However, it can be difficult to interpret and analyze the data gathered from these surveys. Fortunately, Excel provides a powerful set of tools that can help make analyzing survey data easier and more efficient. In this guide, we’ll look at how to use Excel to effectively analyze survey data and uncover the insights it can provide.
How to Analyze Survey Data in Excel?
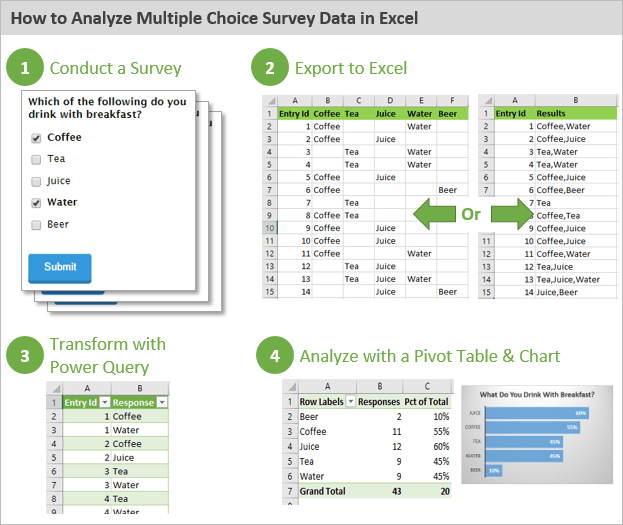
- Open Microsoft Excel.
- Enter the survey data into Excel. This can be done by manually entering the data or by importing a CSV file.
- Organize the data. This can be done by setting up a table in Excel with categories for each type of data.
- Create a graph or chart to visualize the data. This can be done by selecting the data and clicking on the graph or chart type desired.
- Analyze the data. This can be done by looking for patterns or trends in the data as well as by using Excel’s built-in functions such as SUM, AVERAGE and COUNT.

How to Effectively Analyze Survey Data in Excel
Survey data can be extremely valuable and provide great insights into customer feedback, employee morale, and more. To get the most out of your survey data, it’s important to properly analyze it. Excel is a great tool for analyzing survey data and can help you gain a better understanding of the information you have collected. In this article, we will provide an overview of how to analyze survey data in Excel.
Gathering and Preparing the Data
The first step in analyzing survey data in Excel is to gather and prepare the data. This involves collecting the survey results from the software or platform you used to administer the survey and then importing the data into Excel. Once the data is in Excel, you should clean it up by removing any unnecessary columns or rows and ensuring the data is correctly formatted.
Exploring the Data
Once you have prepared the data, the next step is to explore it. This is where you can start to gain insights into the survey data by using Excel’s many built-in functions. You can also use pivot tables and charts to gain a better understanding of the data.
Creating Reports
Once you have explored the data and gained an understanding of the survey results, the next step is to create reports. This is where you can present the survey data in a more presentable format. Excel makes it easy to create reports in the form of charts, tables, and graphs.
Interpreting the Results
Once you have created reports from the survey data, the next step is to interpret the results. This is where you can draw conclusions from the survey data and use it to inform your decision-making.
Using Automation Tools
Finally, you can use automation tools to help with the analysis of survey data in Excel. There are many tools available that can automate the analysis process and make it easier to gain insights from the data.
Creating Dashboards
Dashboards are another great way to present survey data in a visually appealing way. Excel makes it easy to create dashboards with charts and graphs that can be used to quickly and easily understand the survey data.
Using Visualization Tools
Finally, you can use visualization tools to help you gain further insights from the survey data. There are many tools available that can help you visualize the data in interesting and informative ways.
Related FAQ
What is the purpose of analyzing survey data in Excel?
The purpose of analyzing survey data in Excel is to gain insight into customer preferences and opinions. By analyzing survey data, businesses can better understand their customer base and make decisions that are informed by what their customers want. Excel can help to organize survey data and provide graphical representations of data, making it easier to visualize trends and compare different responses. Additionally, Excel can be used to calculate summary statistics such as averages and medians, which can help to provide an overall picture of the survey results.
What is the first step to analyzing survey data in Excel?
The first step to analyzing survey data in Excel is to enter the data into an Excel worksheet. This can be done by copying and pasting the data from the survey into the worksheet, or by importing the data from a CSV file. Once the data is in the worksheet, it can be organized into columns and rows for easier analysis.
What types of charts can be used to visualize survey data in Excel?
There are several types of charts that can be used to visualize survey data in Excel. These include bar charts, line graphs, pie charts, scatter plots, and bubble charts. Each chart type has its own advantages and can be used to display data in different ways. For example, bar charts are useful for comparing different groups, while line graphs are useful for displaying trends over time.
How can summary statistics be calculated in Excel?
Summary statistics such as averages, medians, and standard deviations can be calculated in Excel using built-in functions. To calculate the average of a set of data, the AVERAGE function can be used. To calculate the median, the MEDIAN function can be used. To calculate the standard deviation, the STDEV function can be used. Additionally, Excel can be used to calculate more complex statistical measures such as correlations and regression models.
What are some tips for making sure survey data is accurate?
When collecting survey data, it is important to make sure that the data is accurate and reliable. To do this, surveys should be well-designed and unbiased, and respondents should be asked to provide detailed and honest responses. Additionally, surveys should be designed to ensure that the data is not skewed by including checks for consistency, such as asking the same question in multiple ways or including questions to ensure that respondents are not simply giving predetermined answers.
What are some best practices for analyzing survey data in Excel?
When analyzing survey data in Excel, it is important to make sure that the data is organized properly and that the analysis is performed accurately. To do this, it is important to use meaningful labels for the data, to use consistent formatting, and to make sure that the data is entered correctly. Additionally, it is important to use the appropriate chart types to display the data, and to check the accuracy of the calculations using manual calculations. Finally, summary statistics should be interpreted in the context of the survey data to gain an accurate understanding of the results.
Charting Survey Results in Excel (Visualize Employee Satisfaction results)
Analyzing survey data in Excel is a powerful way to gain insights and make data-driven decisions. With its easy-to-use interface and powerful data analysis tools, Excel provides the perfect platform for quickly and accurately analyzing survey data. Whether you’re a beginner or an advanced user, Excel can help you analyze survey data quickly and accurately. With the right knowledge and tools, you can use Excel to make sense of your survey data and gain valuable insights.
How to Sort Numbers in Excel From Lowest to Highest?
How to Label Columns in Excel?
Related Posts

Small businesses struggle with ERC tax credit submissions

10 Misunderstandings of the Employee Retention Credit

ERC Tax Credit 2023: Is the ERC tax credit still available?
