
How to Add Standard Error Bars in Excel?
Having trouble adding standard error bars to your Excel chart? Don’t worry, you’re not alone! Adding standard error bars to Excel charts can be a tricky task. But, with the right knowledge and a few clicks of the mouse, you can easily add standard error bars to your Excel chart. In this article, we’ll show you how to add standard error bars to your Excel chart and give you some tips to make sure they’re accurate and look great. So, let’s get started!
- Select your chart type and data range. Create a new spreadsheet in Excel. Enter your data into two columns. The first column should contain the data points, while the second column should contain the corresponding standard errors.
- Set up the spreadsheet. Label your columns with the appropriate headings. For example, label the first column “Data Points” and the second column “Standard Error.” Highlight both columns and create a chart by clicking on the Insert tab and selecting the chart type.
- Plot the data. On the chart, select the data points and right-click to select “Add Data Labels.” This will label each data point with its corresponding x and y value.
- Add the standard error bars. Select the chart, click the Layout tab under Chart Tools on the ribbon, and click Error Bars. From the drop-down menu, select the standard error value you want to use.

Introduction to Standard Error Bars in Excel
Standard error bars are used to indicate the variability of data points in a series. They are used to measure the precision of a data set and can help determine if a data set is reliable. Standard error bars in Microsoft Excel can be added to a chart or graph to show the standard error of the data. This tutorial will show you how to add standard error bars in Excel.
Steps to Add Standard Error Bars in Excel
Step 1: Select the Chart
The first step in adding standard error bars to a chart is to select the chart. This can be done by clicking on the chart. Once the chart is selected, right-click on it to open a menu of options.
Step 2: Select ‘Add Error Bars’
Once the chart is selected, select the ‘Add Error Bars’ option from the menu. This will open the ‘Error Bars’ dialog box.
Step 3: Select the Type of Error Bars
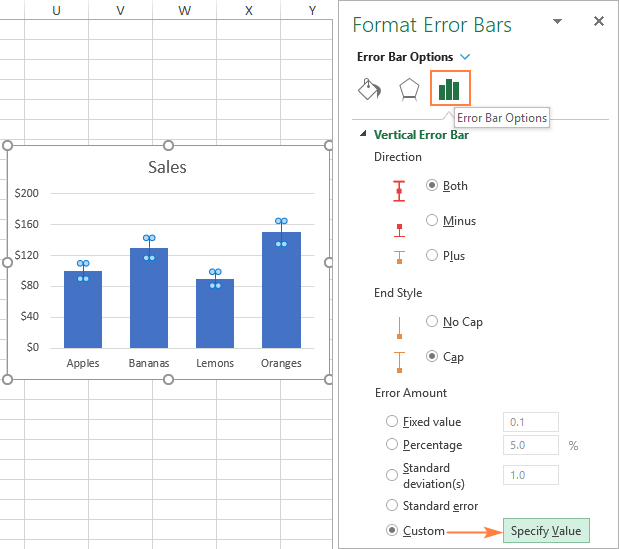
The next step is to select the type of error bars that you want to add. The options available are Standard Error, Percentage Error, Standard Deviation, and Custom. Select the appropriate option for your data set.
Step 4: Select the Direction of Error Bars
Once the type of error bars has been selected, the next step is to select the direction of the error bars. There are two options available: ‘Y Error Bars’ and ‘X Error Bars’. Select the appropriate option depending on the type of chart you are creating.
Step 5: Adjust the Error Bars
Once the direction of the error bars has been selected, the next step is to adjust the error bars. This can be done by entering the appropriate values into the ‘Minimum’ and ‘Maximum’ fields.
Step 6: Add Labels
Once the error bars have been adjusted, the next step is to add labels to the chart. This can be done by selecting the ‘Labels’ tab in the ‘Error Bars’ dialog box. From here, you can select the text for the labels and the associated font size.
Step 7: Finalize the Chart
The final step in adding standard error bars to a chart is to finalize the chart. This can be done by clicking on the ‘OK’ button in the ‘Error Bars’ dialog box. This will add the error bars to the chart.
Conclusion
Adding standard error bars in Excel is a quick and easy process. By following the steps outlined in this tutorial, you can easily add standard error bars to a chart or graph in Excel.
Top 6 Frequently Asked Questions
Q1. What is Standard Error?
Answer: Standard error is a measure of how far the observed values of a statistic deviate from the true population parameter. It provides an estimate of the accuracy of the statistic, and can be used to compare different sets of data. Standard error is also known as the standard deviation of the sample mean.
Q2. What is the difference between Standard Error and Standard Deviation?
Answer: Standard error is the standard deviation of the sample mean, while standard deviation is the standard deviation of all the individual values in a dataset. Standard error is a measure of how far the observed values of the statistic deviate from the true population parameter, while standard deviation is a measure of how much individual values in a dataset vary.
Q3. How do I add Standard Error Bars to Excel?
Answer: To add standard error bars to a graph in Excel, first select the chart. Then, click the ‘Layout’ tab on the ribbon. Under the ‘Analysis’ section, click ‘Error Bars’ and select ‘More Error Bars Options’. Select ‘Standard Error’ from the drop-down menu, and click ‘OK’. The standard error bars will then be added to the graph.
Q4. Is there a way to customize the standard error bars in Excel?
Answer: Yes, it is possible to customize the standard error bars in Excel. After selecting the chart, click the ‘Layout’ tab on the ribbon. Under the ‘Analysis’ section, click ‘Error Bars’ and select ‘More Error Bars Options’. From the ‘Error Amount’ drop-down menu, select the type of error bars to add (e.g. ‘Fixed Value’). Then, enter the value for the error bars and click ‘OK’.
Q5. Can I add standard error bars to a 3D chart in Excel?
Answer: Yes, it is possible to add standard error bars to a 3D chart in Excel. First, select the chart. Then, click the ‘Layout’ tab on the ribbon. Under the ‘Analysis’ section, click ‘Error Bars’ and select ‘More Error Bars Options’. Select ‘Standard Error’ from the drop-down menu, and click ‘OK’. The standard error bars will then be added to the 3D chart.
Q6. Is there a way to add standard error bars to multiple data series in Excel?
Answer: Yes, it is possible to add standard error bars to multiple data series in Excel. First, select the chart and click the ‘Layout’ tab on the ribbon. Under the ‘Analysis’ section, click ‘Error Bars’ and select ‘More Error Bars Options’. Select ‘Standard Error’ from the drop-down menu, and click ‘OK’. The standard error bars will then be added to each data series in the chart.
How To Add Error Bars In Excel (Custom Error Bars)
Adding standard error bars in Excel is a great way to visually represent your data. This can be done by using the Error Bars option under the Chart Tools tab. There are two types of error bars – fixed and dynamic. By adding standard error bars to your charts, you can easily compare different sets of data and draw meaningful conclusions. Therefore, it is important to know how to add standard error bars in Excel. With a few simple steps, you can quickly and easily add standard error bars to your charts.
How to Connect a Keyboard and Mouse to Xbox One?
How to Connect a Keyboard and Mouse to Xbox One?
Related Posts

Small businesses struggle with ERC tax credit submissions

10 Misunderstandings of the Employee Retention Credit

ERC Tax Credit 2023: Is the ERC tax credit still available?
