What is Power Bi Used for?
Power BI is a powerful business intelligence tool that is revolutionizing the way businesses analyze and visualize data. With its intuitive user interface, it is enabling companies to uncover data insights in no time. In this article, we will explore what Power BI is and what it can be used for. From data exploration and visualization to interactive dashboards and AI-driven analytics, get ready to find out how Power BI can help your business make better decisions and become more productive.

Introduction to Power BI
Power BI is a cloud-based business intelligence and analytics platform from Microsoft. It helps business users to analyze data from a variety of sources and create interactive visualizations and reports. Power BI offers a wide range of features, including data preparation, analysis, and visualization. It also provides a number of data connectors so that users can easily connect to their data sources.
Power BI is designed for business users, so it is easy to use and understand. It also provides a number of features to help users create powerful visualizations and reports quickly and easily. Additionally, Power BI is fully integrated with Microsoft Office, so users can easily share and collaborate on their work.
What is Power BI Used For?
Power BI is used by business users to analyze data and create interactive visualizations and reports. It can be used to create a variety of different types of reports and visualizations, including dashboards and insights. Power BI also offers a wide range of features to help users quickly and easily create data-driven insights.
Power BI is also used to connect to a variety of different data sources and to integrate data from multiple sources into a single report or visualization. Additionally, Power BI can be used to automate processes such as data preparation, analysis, and visualization.
Power BI Features
Power BI offers a wide range of features to help users quickly and easily create powerful visualizations and reports. These features include data preparation, analysis, and visualization tools. Additionally, Power BI offers a number of data connectors so that users can easily connect to their data sources.
Power BI also offers a number of features to help users collaborate and share their work. Users can easily share their reports and visualizations with other users and work together on projects. Additionally, Power BI is fully integrated with Microsoft Office, so users can easily share and collaborate on their work.
Data Preparation
Power BI offers a number of features to help users quickly and easily prepare their data for analysis and visualization. These features include data cleansing, data transformation, and data modeling. Additionally, Power BI offers a number of data connectors so that users can easily connect to their data sources.
Data Analysis
Power BI offers a wide range of features to help users analyze their data. These features include data exploration, data aggregation, and data visualization. Additionally, Power BI offers a number of tools to help users create powerful visualizations and reports quickly and easily.
Data Visualization
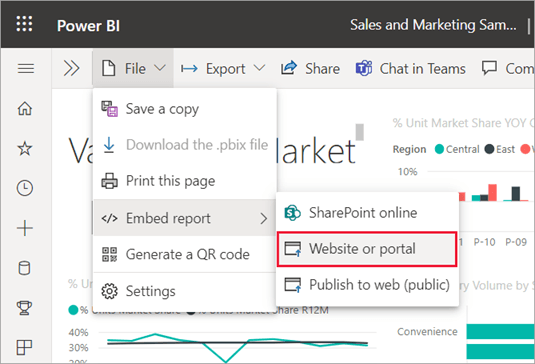
Power BI offers a wide range of features to help users create powerful visualizations and reports. These features include interactive visualizations, dashboard creation, and report sharing. Additionally, Power BI offers a number of tools to help users customize their visualizations and reports.
Data Connectors
Power BI offers a number of data connectors so that users can easily connect to their data sources. These connectors include ODBC, OData, and SharePoint Online. Additionally, Power BI offers a number of cloud-based data sources including Azure SQL Database, Azure Data Lake, and Azure Data Warehouse.
Collaboration
Power BI offers a number of features to help users collaborate and share their work. Users can easily share their reports and visualizations with other users and work together on projects. Additionally, Power BI is fully integrated with Microsoft Office, so users can easily share and collaborate on their work.
Integration with Microsoft Office
Power BI is fully integrated with Microsoft Office, so users can easily share and collaborate on their work. Additionally, Power BI offers a number of tools to help users customize their visualizations and reports. These tools include Excel, PowerPoint, and Word.
Security and Privacy
Power BI offers a number of features to help ensure the security and privacy of users’ data. These features include data encryption, authentication, and role-based access control. Additionally, Power BI offers a number of tools to help users manage their data and ensure that it is secure.
Related Faq
What is Power BI Used for?
Answer: Power BI is a Microsoft-developed business intelligence platform designed to enable organizations to quickly and easily analyze data from multiple sources. It can be used to create interactive dashboards and reports to help organizations gain insights from their data, as well as to collaborate with colleagues to explore data and share insights. Power BI is cloud-based, allowing organizations to access data from anywhere, anytime.
What are the Benefits of Using Power BI?
Answer: The main benefits of using Power BI are the ability to easily analyze data from multiple sources, the ability to create interactive dashboards and reports, and the ability to collaborate with colleagues to explore data and share insights. Power BI also allows organizations to access data from anywhere, anytime, and it provides a comprehensive set of features such as data visualization, data modeling, data manipulation, and more. Additionally, Power BI is scalable, allowing organizations to grow their data analysis capabilities without having to invest in additional infrastructure.
What Platforms does Power BI Support?
Answer: Power BI is supported on multiple platforms, including Windows, Mac, iOS, Android, and the web. Additionally, organizations can deploy Power BI on-premises or in the cloud.
What Types of Data are Compatible with Power BI?
Answer: Power BI is compatible with a variety of data sources, including relational databases, spreadsheets, big data sources, and web services. Additionally, Power BI can integrate with other Microsoft products such as Excel and SharePoint.
How can Organizations Use Power BI?
Answer: Organizations can use Power BI to create interactive dashboards and reports that help them gain insights from their data. Additionally, they can use Power BI to collaborate with colleagues to explore data and share insights. Furthermore, organizations can use Power BI to identify correlations and trends in their data, as well as to forecast future trends.
What are Some Examples of Power BI Use Cases?
Answer: Power BI can be used in a variety of industries, including retail, healthcare, finance, and manufacturing. Some examples of Power BI use cases include analyzing customer data to identify areas of improvement, forecasting sales trends, and predicting customer churn. Additionally, Power BI can be used for marketing analytics, such as tracking customer engagement and optimizing lead generation.
What is PowerBI and why use it?
Power BI is an incredibly powerful tool that can help businesses of all sizes improve their data analysis. With its visualizations and dashboards, it can quickly help identify trends and issues in data, enabling businesses to make more informed decisions. Its ability to integrate with other data sources makes it a versatile tool that can be used to help businesses gain insights and make better decisions. Power BI is a must-have tool for businesses looking to gain greater insights from their data and make better decisions.
How to Schedule Reports in Power Bi?
How to Connect Google Analytics to Power Bi?
Related Posts
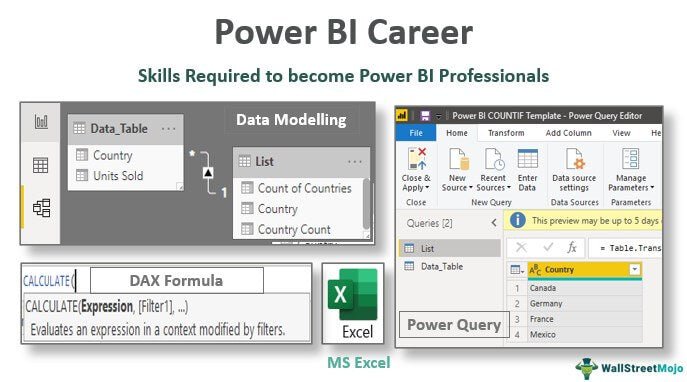
Switch Careers with Power BI Career: Your Path to Success
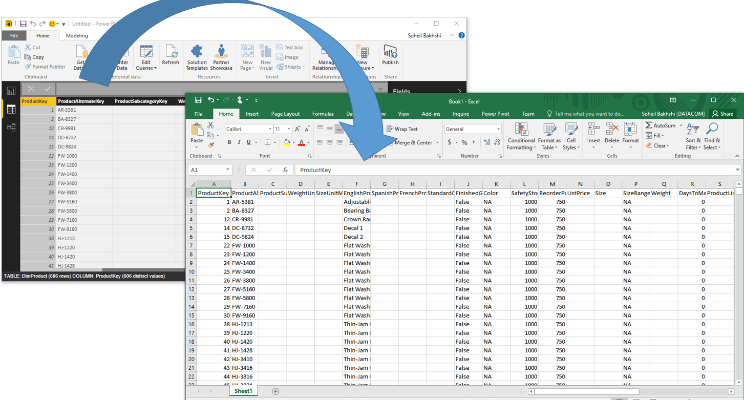
How to Export Power Bi Report to Excel?
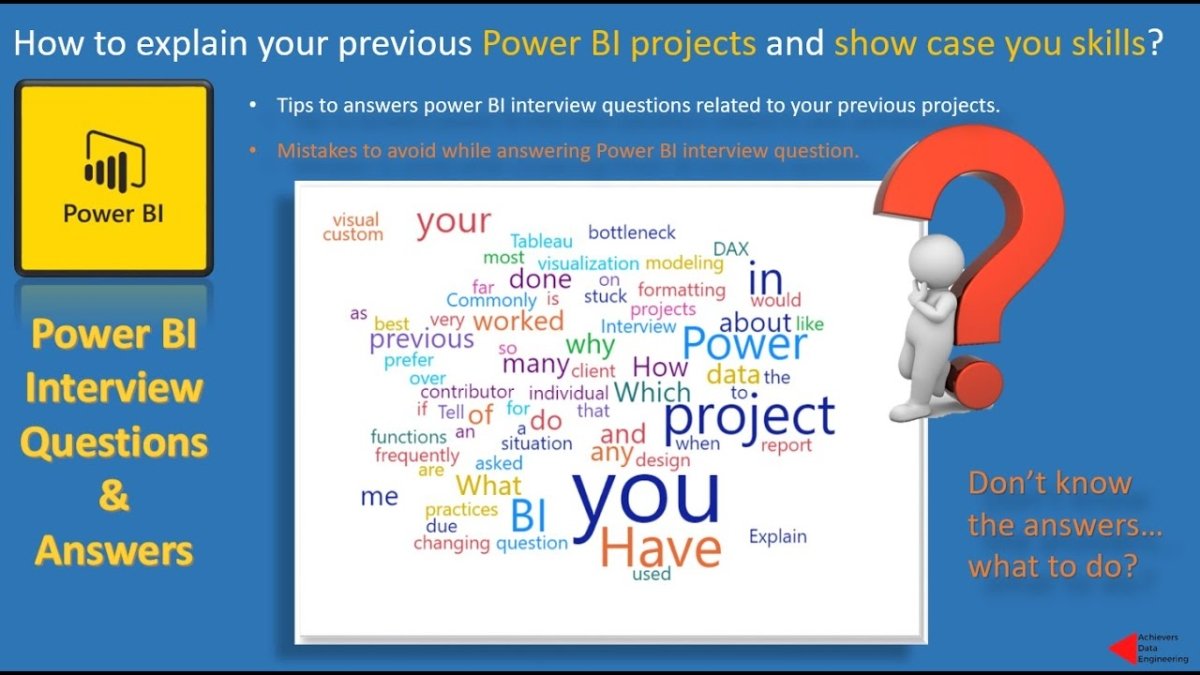
How to Explain Power Bi Project in Interview?
How to Enable Power Bi in Office 365?