
Why Power Bi is Important?
Power BI is an incredibly powerful business intelligence tool that can help organizations unlock valuable insights from their data. It’s an invaluable asset for any company that wants to remain competitive in today’s ever-evolving digital landscape. In this article, we’ll discuss why Power BI is essential for businesses and how it can help you make better data-driven decisions. We’ll also look at the features that make Power BI so powerful and how it can be implemented in a variety of business scenarios. By the end of this article, you’ll have a better understanding of why Power BI is essential, and how it can help your organization stay ahead of the competition.
Power BI is important because it allows users to easily analyze data from multiple sources, create visually appealing and interactive reports, and share insights with their team. It also provides real-time data insights, helping users to make informed decisions quickly. Additionally, Power BI integrates with other Microsoft products, such as Excel, giving users access to a vast array of data manipulation tools.
What is Power BI and Why Is It Important?
Power BI is a business intelligence (BI) platform from Microsoft that enables users to quickly and easily create insights from their data. It is a suite of tools that enable users to connect to data sources, transform and analyze data, and create interactive visuals and reports. It is a powerful tool for data visualization and analysis, and has become increasingly popular in recent years.
Power BI has a number of advantages over traditional methods of data analysis. It is easy to use, with a user-friendly interface that makes it suitable for users with minimal technical knowledge. It can also be used to create interactive visuals and dashboards that can be shared with colleagues, which allows users to quickly access and visualize data. Additionally, it integrates with other Microsoft services, such as Excel and SharePoint, which makes it easier to manage data and collaborate with other users.
Overall, Power BI is an important tool for businesses that need to quickly access and analyze data. It is easy to use and can be used to create interactive visuals and reports, allowing users to quickly understand their data and make informed decisions.
How Does Power BI Work?
Power BI is a suite of tools that enable users to connect to data sources, transform and analyze data, and create interactive visuals and reports. The core of Power BI is the Power BI Desktop application, which can be used to connect to data sources, transform and analyze data, and create interactive visuals and dashboards.
Once data is connected and imported, users can use Power BI to transform and analyze data using a variety of methods, such as creating calculated columns, using built-in functions, and using Power Query. Power BI also includes a range of machine learning algorithms and natural language processing capabilities, allowing users to quickly and easily extract insights from their data.
Once data has been analyzed, users can then create interactive visuals and dashboards. Power BI includes a range of visualizations, such as maps, charts, and tables, which can be used to quickly and easily create visuals that are easy to understand. Power BI also enables users to easily share their visuals and dashboards with colleagues, allowing them to quickly access and visualize data.
Advantages of Power BI
Power BI is a powerful tool for data visualization and analysis, and has become increasingly popular in recent years. It has a number of advantages over traditional methods of data analysis, including its ease of use, ability to connect to a range of data sources, and ability to create interactive visuals and dashboards.
Easy to Use
Power BI has a user-friendly interface that makes it suitable for users with minimal technical knowledge. It includes a range of features that make it easy to connect to data sources, transform and analyze data, and create visuals and dashboards. Additionally, it integrates with other Microsoft services, such as Excel and SharePoint, which makes it easier to manage data and collaborate with other users.
Connect to a Range of Data Sources
Power BI can connect to a range of data sources, including databases, files, and cloud services. This makes it easy to access and analyze data from multiple sources, allowing users to quickly and easily extract insights from their data.
Create Interactive Visuals and Dashboards
Power BI includes a range of visualizations, such as maps, charts, and tables, which can be used to quickly and easily create visuals that are easy to understand. Additionally, Power BI enables users to easily share their visuals and dashboards with colleagues, allowing them to quickly access and visualize data.
Top 6 Frequently Asked Questions
What is Power BI?
Power BI is a cloud-based business analytics service provided by Microsoft. It allows users to visualize and analyze data with greater speed, efficiency and understanding. Power BI provides a comprehensive set of tools and services that allow users to collect, transform, model, and analyze data from any source. Power BI also provides a suite of dashboarding and reporting capabilities that enable users to quickly explore and share insights from their data.
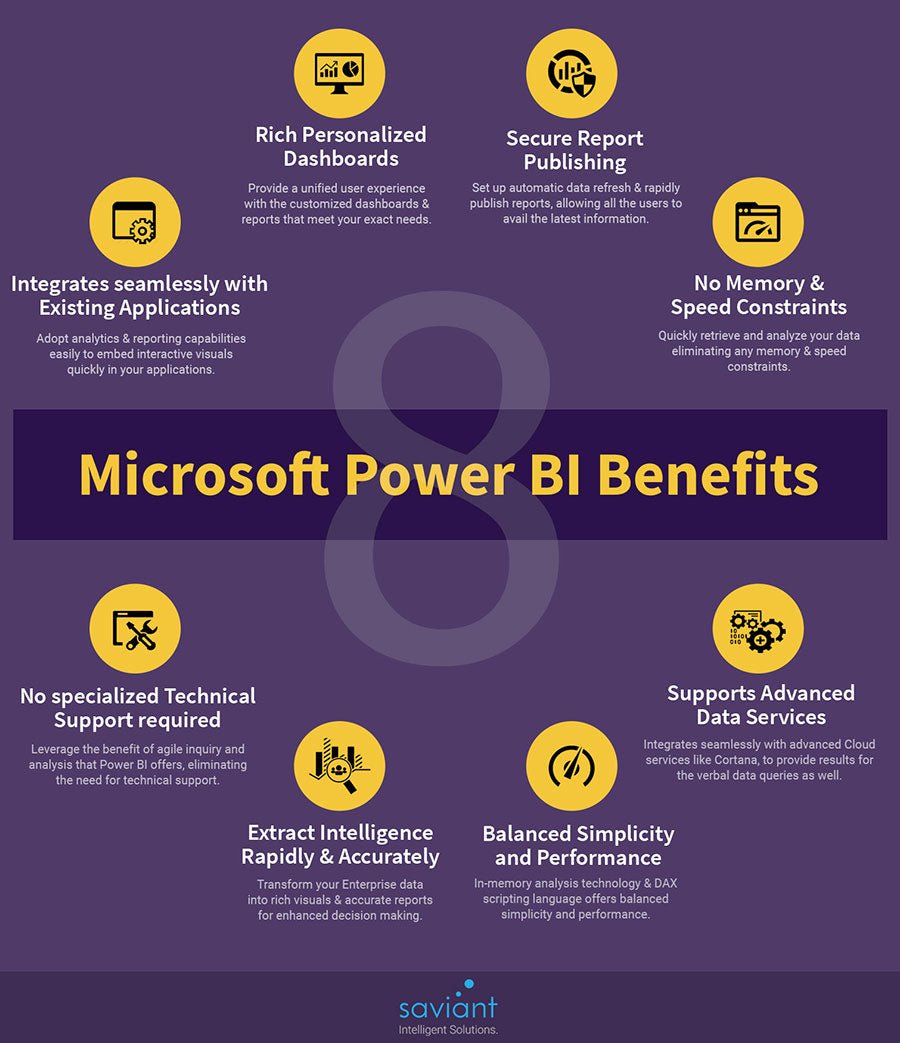
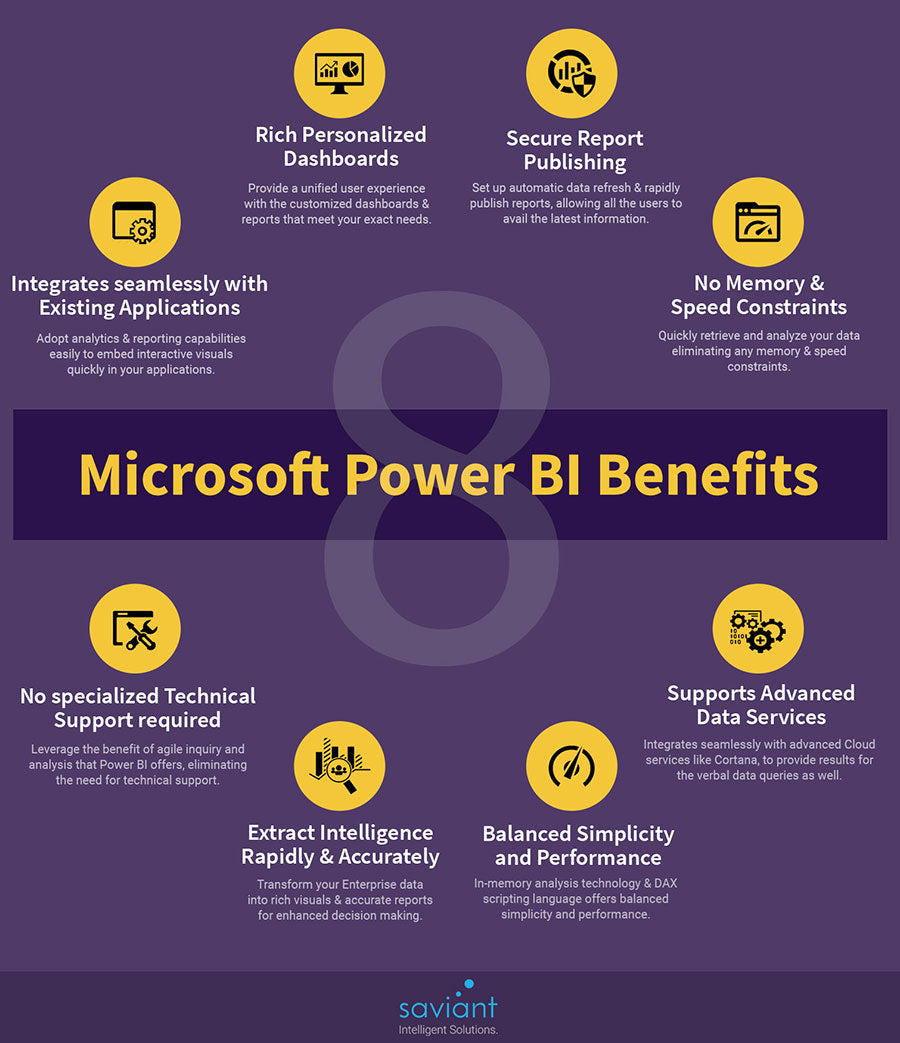
What are the Benefits of using Power BI?
There are many benefits to using Power BI. It allows users to quickly and easily create visually appealing dashboards and reports to gain insights from their data. It also allows users to quickly explore and share insights with others. Additionally, Power BI provides an easy-to-use interface, making it simple for users to create and customize reports. Finally, Power BI provides a range of data sources, allowing users to integrate data from multiple sources.
How Does Power BI Help Businesses?
Power BI helps businesses by providing a comprehensive set of tools and services that allow them to quickly and easily collect, transform, model, and analyze data from any source. This enables businesses to gain insights from their data and make informed decisions. Additionally, Power BI’s dashboarding and reporting capabilities allow businesses to quickly explore and share insights with their teams.
What is the Cost of Power BI?
Power BI is available as a subscription service and is offered in three tiers: Free, Pro, and Premium. The Free tier is free and includes basic features for creating and sharing dashboards and reports. The Pro tier is $9.99 per month per user and allows for additional features such as data integration and collaboration. The Premium tier is available for an additional fee and provides advanced features such as data governance and advanced data modeling.
What is the Difference between Power BI and Excel?
Power BI and Excel are both powerful business analytics tools, however, they have different capabilities. Power BI is a cloud-based service that enables users to quickly and easily create visually appealing dashboards and reports to gain insights from their data. Excel is a spreadsheet program that allows users to analyze data in a more traditional way. While Excel can provide basic insights, Power BI provides a more comprehensive set of tools and services that allow users to explore and share insights with their teams.
Why is Power BI Important?
Power BI is an important tool for businesses as it allows them to quickly and easily visualize and analyze data from any source. Power BI’s comprehensive set of tools and services enables businesses to gain insights from their data and make informed decisions. Additionally, Power BI’s dashboarding and reporting capabilities allow businesses to quickly explore and share insights with their teams. By using Power BI, businesses can gain a competitive edge and be more successful.
What is PowerBI and why use it?
Power BI is a crucial tool for modern businesses. It allows organizations to quickly and easily analyze complex data and make informed decisions. With Power BI, businesses can save time and money by quickly identifying trends, issues, and patterns in their data. It can be used to create dashboards and reports to better understand their data, and to gain insights and make more informed decisions. Power BI is an invaluable tool for businesses of any size, and it is becoming increasingly important to have in order to remain competitive in today’s data-driven world.
Why Power Bi is Better Than Excel?
How Much Does Microsoft Power Bi Cost?
Related Posts

Small businesses struggle with ERC tax credit submissions

10 Misunderstandings of the Employee Retention Credit

ERC Tax Credit 2023: Is the ERC tax credit still available?
