
How to Find Q1 and Q3 in Excel?
Are you looking for an easy and straightforward way to find the first and third quartiles (Q1 and Q3) in Excel? Quartiles can be used to quickly summarize a data set by dividing it into four equal parts. Luckily, Excel provides a few different methods to calculate quartiles with ease. In this article, we’ll walk you through each of these methods so you can find Q1 and Q3 in Excel in no time.
How to Find Q1 and Q3 in Excel?
1. Open your Excel spreadsheet and select the data set you want to analyze.
2. Click the “Data” tab and select the “Descriptive Statistics” option.
3. Select the “Summary Statistics” option, check the “Quartiles” box, and click “OK”.
4. The lower quartile (Q1) and the upper quartile (Q3) will be displayed in the resulting Excel table.

Understanding the Basics of the Q1 and Q3 Values in Excel
Q1 and Q3 are two of the most commonly used values when it comes to data analysis in Excel. Q1 stands for the first quartile and Q3 stands for the third quartile. These two values are used to measure the spread of data within a dataset. In other words, they are used to measure how spread out the data is. They are also important to identify outliers and to identify any patterns or trends in the data.
Q1 and Q3 are calculated using the quartile formula, which takes the values of a dataset and divides them into four equal parts. The first quartile (Q1) is the value at which 25% of the data points fall below, and the third quartile (Q3) is the value at which 75% of the data points fall below. This means that Q1 and Q3 are used to divide a dataset into two halves, with Q1 representing the lower half and Q3 representing the upper half.
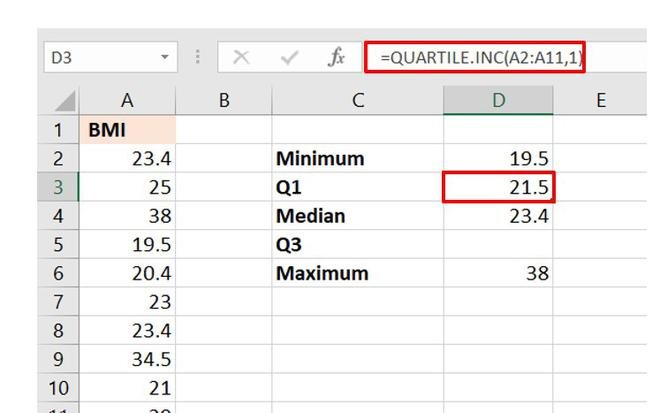
To calculate Q1 and Q3 in Excel, it is important to first sort the data from smallest to largest. This will ensure that the quartiles are calculated correctly. Once the data is sorted, the quartile formula can be used to calculate the Q1 and Q3 values. The quartile formula is =QUARTILE(array,quart), where ‘array’ is the range of cells containing the data and ‘quart’ is the quartile number (1 for Q1 and 3 for Q3).
Using Q1 and Q3 in Data Analysis
Q1 and Q3 values are used in data analysis to determine the spread of a dataset. They are also important for identifying outliers, which are data points that are significantly different from the rest of the dataset. Outliers can have a significant impact on the results of a data analysis, so it is important to identify and account for them.
In addition to identifying outliers, Q1 and Q3 can also be used to identify patterns or trends in a dataset. For example, if the Q1 and Q3 values are close together, this may indicate that the data is not spread out and may suggest a pattern or trend. On the other hand, if the Q1 and Q3 values are further apart, this may indicate that the data is more spread out and may suggest that there is no pattern or trend.
Interpreting the Results of Q1 and Q3 Calculations
Once Q1 and Q3 have been calculated, it is important to interpret the results. The results should be used to identify any outliers present in the dataset, as well as any patterns or trends. It is also important to compare the Q1 and Q3 values to the mean and median values, as this can provide further insight into the spread of the data.
Using Q1 and Q3 in Excel
The Q1 and Q3 values can be easily calculated in Excel using the quartile formula. It is important to first sort the data from smallest to largest before calculating the Q1 and Q3 values. Once the values have been calculated, they should be interpreted and compared to the mean and median values to gain further insight into the spread of the data.
Using Q1 and Q3 to Identify Outliers
Q1 and Q3 can also be used to identify outliers in a dataset. Any data points that fall outside of the range of Q1 and Q3 are considered to be outliers. It is important to identify and account for outliers, as they can have a significant impact on the results of a data analysis.
Using Q1 and Q3 to Identify Patterns or Trends
Q1 and Q3 can also be used to identify any patterns or trends in a dataset. If the Q1 and Q3 values are close together, this may indicate that the data is not spread out and may suggest a pattern or trend. On the other hand, if the Q1 and Q3 values are further apart, this may indicate that the data is more spread out and may suggest that there is no pattern or trend.
Top 6 Frequently Asked Questions
Question 1: What is a Q1 and Q3 in Excel?
Answer: Q1 and Q3 are quartiles in Excel, which refer to the 25th and 75th percentiles of a data set, respectively. They are a way to measure the spread of a set of data. Q1 represents the value that is greater than 25% of the values and lower than the remaining 75%, while Q3 represents the value greater than 75% of the values and lower than the remaining 25%.
Question 2: How do I calculate Q1 and Q3 in Excel?
Answer: To calculate Q1 and Q3 in Excel, you must first arrange your data in a numerical order from smallest to largest. Then, select the range of data and use the QUARTILE function. This function will return the Q1 and Q3 values for the selected range.
Question 3: What is the syntax for the QUARTILE function?
Answer: The syntax for the QUARTILE function is:
=QUARTILE(array,quart). The “array” argument is the range of values from which you want to find the quartiles. The “quart” argument is a number from 0 to 4, which specifies which quartile you want to calculate. For example, to calculate the first quartile, you would use “1”, and to calculate the third quartile, you would use “3”.
Question 4: What if my data is not in numerical order?
Answer: If your data is not in numerical order, you can still use the QUARTILE function. You must first sort your data in numerical order, then select the range and use the QUARTILE function.
Question 5: How do I know my data is in numerical order?
Answer: To check that your data is in numerical order, you can use the SORT function. This function will sort your data from smallest to largest, and will also return an error if there are any non-numeric values in the range.
Question 6: What is the syntax for the SORT function?
Answer: The syntax for the SORT function is:
=SORT(array,sort_order,by_col). The “array” argument is the range of values you want to sort. The “sort_order” argument is a number from 0 to 2, which specifies whether you want to sort the data in ascending (0) or descending (1) order. The “by_col” argument is a Boolean value which is set to TRUE (1) if you want to sort the data by column, or FALSE (0) if you want to sort the data by row.
Find Q1 and Q3 using Excel
The Quartiles, Q1 and Q3, are an important part of data analysis. Knowing how to calculate these in Excel can help you quickly and accurately analyze data and draw meaningful conclusions. With the help of the built-in Excel quartile functions, you can easily find Q1 and Q3 in Excel. All you need to do is to provide the data set, specify the quartile you want to calculate, and Excel will do the rest for you. With this simple technique, you can now find Q1 and Q3 quickly and accurately to get the most out of your data.
How to Create a Stacked Bar Chart in Excel?
How to Write a Paragraph in Excel?
Related Posts

Small businesses struggle with ERC tax credit submissions

10 Misunderstandings of the Employee Retention Credit

ERC Tax Credit 2023: Is the ERC tax credit still available?
