
How to Find Probability in Excel?
Are you looking for an easy way to calculate probability in Microsoft Excel? If so, then you’ve come to the right place. In this guide, we’ll show you how to use a few simple formulas to find probability in Excel quickly and accurately. We’ll also include a few tips and tricks to help you get the most out of your calculations. Whether you’re a student or a professional, learning how to calculate probability in Excel can be a valuable skill. So let’s get started!
Finding Probability in Excel is easy. You can find the probability of a range of values with the following steps:
- Open the Microsoft Excel spreadsheet and click the “Data” tab.
- Select “Data Analysis” from the ribbon.
- Choose “Probability Distributions” from the list of tools.
- Input the parameters for the probability range you want to calculate.
- Choose the output range.
- Check “Labels” if you want the output to include labels.
- Press “OK” to find the probability.

Introduction: How to Utilize Excel to Calculate Probability
Microsoft Excel is a powerful tool for data analysis. It can be used to calculate probability, which can then be used to make predictions or decisions. In this article, we will discuss how to use Excel to calculate probability. We will cover the different formulas and functions available, as well as how to interpret the results of the calculations.
Formulas and Functions for Calculating Probability in Excel
There are a variety of formulas and functions available in Excel for calculating probability. The most commonly used are the COUNTIF and SUMIF functions. The COUNTIF function counts the number of cells in a range that meet a specific criteria. The SUMIF function sums the values of cells in a range that meet a specific criteria.
The FREQUENCY function can also be used to calculate probability. This function calculates the frequency of values in a range. It can also be used to calculate the probability of an event by dividing the number of occurrences of the event by the total number of events.
Using Excel to Calculate Probability Based on Data
When using Excel to calculate probability based on data, the first step is to enter the data into a worksheet. This data should be organized into columns and rows. Once the data is entered, the formulas and functions discussed above can be used to calculate the probability of an event or outcome.
For example, if you wanted to calculate the probability of a certain event occurring, you could use the COUNTIF function to count the number of occurrences of the event and then divide this number by the total number of events.
Using Excel to Calculate Probability Based on Probability Distribution
In addition to using Excel to calculate probability based on data, it can also be used to calculate probability based on a probability distribution. A probability distribution is a mathematical representation of the likelihood of an event or outcome occurring.
The most common type of probability distribution is the normal distribution, which is also known as the bell curve. The normal distribution is used to calculate the probability of an event or outcome occurring based on its standard deviation from the mean.
In Excel, the NORMDIST function can be used to calculate the probability of an event or outcome occurring based on its standard deviation from the mean. This function takes the mean, standard deviation, and value of the event or outcome as parameters and returns the probability of the event or outcome occurring.
Interpreting the Results of Probability Calculations in Excel
Once you have used Excel to calculate the probability of an event or outcome occurring, it is important to interpret the results of the calculations. In general, the result of a probability calculation is a number between 0 and 1. A result of 0 indicates that the event or outcome is impossible, while a result of 1 indicates that the event or outcome is certain.
A result between 0 and 1 indicates that the event or outcome is possible but not certain. The closer the result is to 0, the less likely the event or outcome is to occur. The closer the result is to 1, the more likely the event or outcome is to occur.
Using Excel to Calculate Probability Based on Other Probability Distributions
In addition to the normal distribution, Excel can also be used to calculate probability based on other probability distributions. These include the binomial distribution, Poisson distribution, and chi-square distribution. The formulas and functions used to calculate probability based on these distributions are similar to those used with the normal distribution.
Conclusion
In this article, we discussed how to use Excel to calculate probability. We discussed the different formulas and functions available, as well as how to use them to calculate probability based on data or a probability distribution. We also discussed how to interpret the results of the calculations. Excel is a powerful tool for data analysis and can be used to make predictions or decisions based on probability calculations.
Top 6 Frequently Asked Questions
What is Probability?
Probability is the chance of an event occurring, given a certain set of conditions. It is a numerical measure of how likely an event is to occur, expressed as a number between 0 and 1 (where 0 indicates impossibility and 1 indicates certainty). Probability can be used to make predictions about future events and to calculate the expected outcomes of decisions.
How Can I Find Probability in Excel?
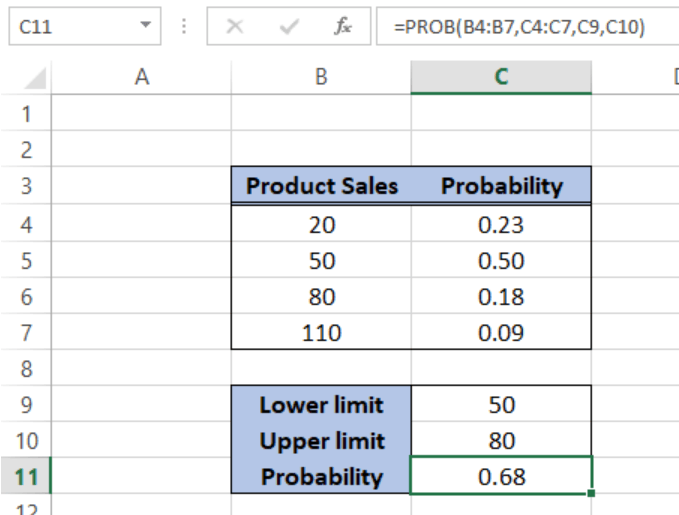
Excel is an excellent tool for calculating probability. It includes a range of built-in functions to help you calculate the probability of an event occurring. This includes the “PROB” function, which can be used to calculate the probability of a discrete event happening, and the “NORMDIST” function, which can be used for calculating the probability of a continuous event occurring.
What Are the Steps for Calculating Probability in Excel?
1. Firstly, create a spreadsheet with the relevant data.
2. Choose the function you would like to use (e.g., PROB or NORMDIST).
3. Enter the parameters for the function, such as the probability distribution, the range of values, and the number of trials.
4. Calculate the value of the function by pressing the ‘Enter’ key.
What Are Some Examples of Calculating Probability in Excel?
Some examples of calculating probability in Excel include:
• Calculating the probability of rolling a 6 on a 6-sided die.
• Calculating the probability of drawing a red card from a standard deck of cards.
• Calculating the probability of rolling a 5 or 6 on two 6-sided dice.
• Calculating the probability of getting heads on a coin toss.
Are There Any Limitations to Calculating Probability in Excel?
Yes, there are limitations to calculating probability in Excel. The PROB and NORMDIST functions only work with discrete data, meaning that they cannot be used to calculate the probability of a continuous event occurring. Additionally, these functions do not take into account any additional factors that may affect the probability of an event occurring.
What Are Some Alternatives to Calculating Probability in Excel?
If you need to calculate the probability of a continuous event occurring, or take into account additional factors, then you may want to consider using a different software program. Some alternatives to Excel include:
• R programming language – Used for statistical computing and data analysis.
• Wolfram Alpha – A web-based computational knowledge engine.
• Mathematica – A software program used for symbolic and numerical computing.
How to Use Excel to Calculate Probabilities : Advanced Microsoft Excel
In conclusion, probability is a useful tool to have in your Excel toolbox. It allows you to gain insight into the probability of certain events occurring, and can be used to make informed decisions. With a few simple steps, you can easily find probability in Excel, giving you the power to make informed decisions quickly and easily.
How to Remove Duplicate in Excel?
How to Calculate Monthly Loan Payment in Excel?
Related Posts

Small businesses struggle with ERC tax credit submissions

10 Misunderstandings of the Employee Retention Credit

ERC Tax Credit 2023: Is the ERC tax credit still available?
