
How to Find Cumulative Frequency in Excel?
Are you looking for a way to quickly and easily calculate cumulative frequency in Excel? Whether you’re a student, a business owner, or a data scientist, knowing how to calculate cumulative frequency in Excel is an important skill to have. In this article, we’ll show you step-by-step how to find cumulative frequency in Excel, as well as discuss some of the most common uses for this type of analysis. With this knowledge, you’ll be able to quickly and accurately analyze your data and make informed decisions. So let’s get started!
Cumulative Frequency in Excel can be found using the COUNTIF function. To use this function, first create a data set with the values you are interested in. Then type in the formula =COUNTIF(range, criterion) in a new cell. Replace ‘range’ with the cell range you created, and ‘criterion’ with the value you want to find the cumulative frequency of. This will give you the cumulative frequency of that value in your data set.
Step-by-step Tutorial:
- Create a data set with the values you are interested in.
- Type in the formula =COUNTIF(range, criterion) in a new cell.
- Replace ‘range’ with the cell range you created, and ‘criterion’ with the value you want to find the cumulative frequency of.
- Press Enter. This will give you the cumulative frequency of that value in your data set.

What is Cumulative Frequency in Excel?
Cumulative frequency is a statistical concept that shows the total number of events that have occurred up to a certain point in a sequence of events. In Excel, it is used to quickly identify the total number of occurrences of a given element in a sequence of data. Cumulative frequency is used in a variety of statistical applications, such as to find the median, quartiles, and outliers.
Cumulative frequency is calculated by adding up the frequency of each element in a sequence of data. For example, if you had a list of numbers, you would calculate the cumulative frequency by adding up the frequency of each number in the list. This would give you a total count of the number of occurrences of that particular number in the data set.
How to Find Cumulative Frequency in Excel?
The process of finding cumulative frequency in Excel is relatively simple. First, you need to enter your data into the Excel worksheet. Once the data is entered, you can use the SUMIFS function to calculate the cumulative frequency.
The SUMIFS function requires two arguments: a range of cells and a criteria. The range of cells should include the values that you want to calculate the cumulative frequency for. The criteria should refer to the value that you want to calculate the cumulative frequency for.
For example, if you wanted to calculate the cumulative frequency for the number 5 in the data set, then you would use the range of cells that contain the numbers in the data set and the criteria would be “5”. The SUMIFS function will then calculate the cumulative frequency for that particular number.
Using Excel Charts to Visualize Cumulative Frequency
Once you have calculated the cumulative frequency for a particular element, you can use Excel charts to visualize the data. To do this, you need to create a bar chart with the cumulative frequency as the y-axis and the values as the x-axis. This will give you a visual representation of the cumulative frequency of the particular element in the data set.
You can also use charts to compare the cumulative frequency of multiple elements in the data set. To do this, you need to create a line chart with the cumulative frequency as the y-axis and the values as the x-axis. This will give you a visual representation of the relative cumulative frequency of the different elements in the data set.
Using Pivot Tables to Calculate Cumulative Frequency
In addition to using the SUMIFS function, you can also use pivot tables to calculate the cumulative frequency. Pivot tables are a powerful tool in Excel that allow you to quickly analyze data and make sense of it. To calculate the cumulative frequency using a pivot table, you need to create a pivot table with the values as the rows, the cumulative frequency as the values, and the criteria as the filter.
For example, if you wanted to calculate the cumulative frequency for the number 5 in the data set, then you would use the value 5 as the filter and the cumulative frequency as the value. The pivot table will then calculate the cumulative frequency for that particular number.
Using Formulas to Calculate Cumulative Frequency
In addition to using the SUMIFS function and pivot tables, you can also use formulas to calculate the cumulative frequency. This is done by using the COUNTIFS and SUMIFS functions together. The COUNTIFS function is used to count the number of occurrences of a particular element in the data set and the SUMIFS function is used to sum up the frequencies of the elements in the data set.
For example, if you wanted to calculate the cumulative frequency for the number 5 in the data set, then you would use the COUNTIFS function to count the number of occurrences of 5 in the data set and the SUMIFS function to sum up the frequencies of the elements in the data set. The result of these two functions will give you the cumulative frequency for the number 5 in the data set.
Advantages of Using Cumulative Frequency in Excel
Using cumulative frequency in Excel has a number of advantages. First, it is a quick and easy way to identify the total number of occurrences of a given element in a sequence of data. This can be useful for a variety of applications, such as to find the median, quartiles, and outliers.
Second, cumulative frequency can be visualized using Excel charts. This allows you to quickly identify trends in the data set and make sense of the data. Third, cumulative frequency can be calculated using formulas, which can be useful for more complex data sets.
Finally, cumulative frequency can be calculated using pivot tables. This can be useful for quickly analyzing large data sets and making sense of the data.
Related FAQ
What is Cumulative Frequency?
Cumulative frequency is a statistical term used to describe the running total of frequencies of a particular data set. Cumulative frequency is calculated by adding each frequency from a frequency distribution table to the sum of its predecessors. This gives a running total of the frequencies. It provides a visual representation of how data is distributed over a given range of values.
How Does Cumulative Frequency Work?
Cumulative frequency works by counting the number of times a data point appears in a data set. For example, if a data set contains 10 values, then a cumulative frequency table will show the total number of times each value appears in the data set. The cumulative frequency table is used to determine the total number of values within a given range.
What is the Formula for Cumulative Frequency?
The formula for calculating cumulative frequency is:
Cumulative Frequency = Previous Cumulative Frequency + The Frequency of the Current Class.
How to Find Cumulative Frequency in Excel?
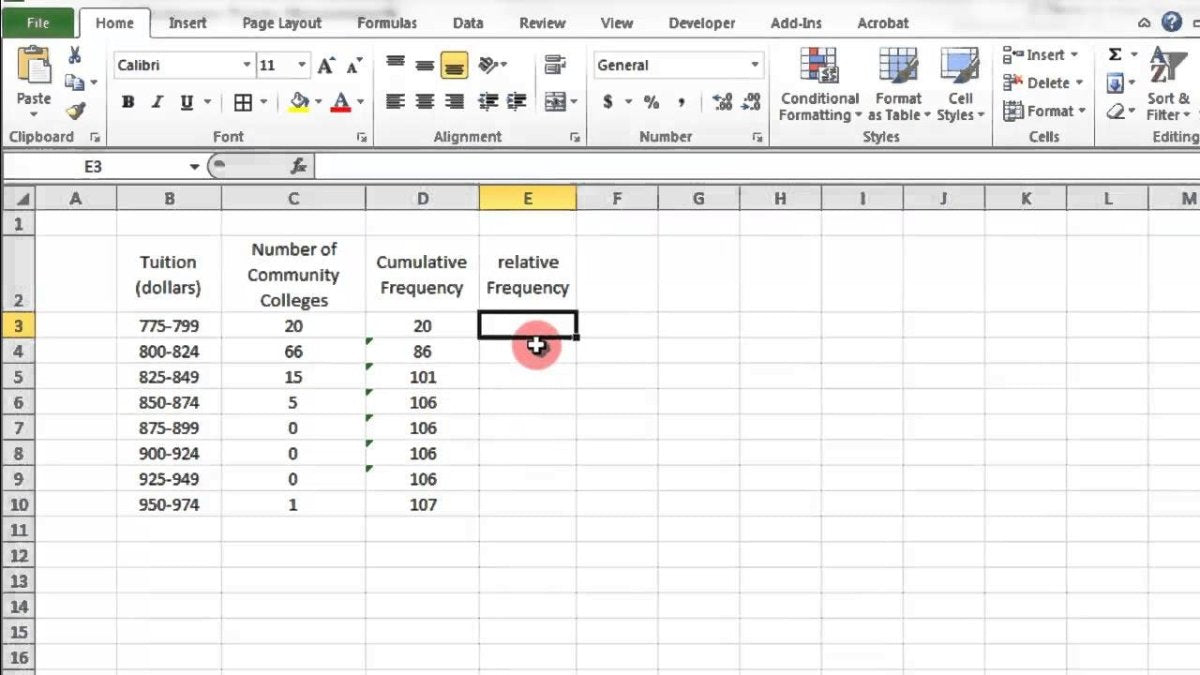
Finding cumulative frequency in Excel is a relatively simple process. The first step is to create a frequency table. This table should contain the classes and the corresponding frequencies. Once the frequency table is created, a cumulative frequency column can be added by using the formula:
Cumulative Frequency = Previous Cumulative Frequency + The Frequency of the Current Class.
What Are the Advantages of Using Cumulative Frequency?
Cumulative frequency provides a quick and easy way to determine the total number of values within a given range. It also allows us to quickly identify the distribution of a data set. In addition, it can be used to compare different data sets and draw conclusions based on the data.
What Are the Disadvantages of Using Cumulative Frequency?
One of the main disadvantages of using cumulative frequency is that it is difficult to interpret the results. In addition, it can be difficult to determine the exact distribution of the data. Finally, cumulative frequency does not provide a detailed analysis of the data.
In summary, finding cumulative frequency in Excel can be done by first inputting your data into the program. Then highlight the data, select the “Data Analysis” tab, select the “Frequency” option, set the bins, and click “OK”. This will generate the frequency table that will contain the cumulative frequency of your dataset. With this information, you can then analyze your data more accurately and draw meaningful conclusions from it.
How to Insert Checkbox in Excel 2016?
How to Use Text Formula in Excel?
Related Posts

Small businesses struggle with ERC tax credit submissions

10 Misunderstandings of the Employee Retention Credit

ERC Tax Credit 2023: Is the ERC tax credit still available?
