
How to Run a T Test in Excel?
Are you looking for an easy way to run a t-test in Excel? If so, you’ve come to the right place! In this article, we’ll discuss how to set up and run a t-test in Excel, including how to interpret the results and make accurate conclusions. We’ll also provide tips and tricks for making the process simpler and more efficient. With this guide, you’ll be able to quickly and accurately run a t-test in Excel and make data-driven decisions. Let’s get started!
Running a T Test in Excel is a simple process. To do so, follow the steps below:
- Open Excel and set up two columns, one for each group you are comparing.
- Label the columns, and enter the data into each column.
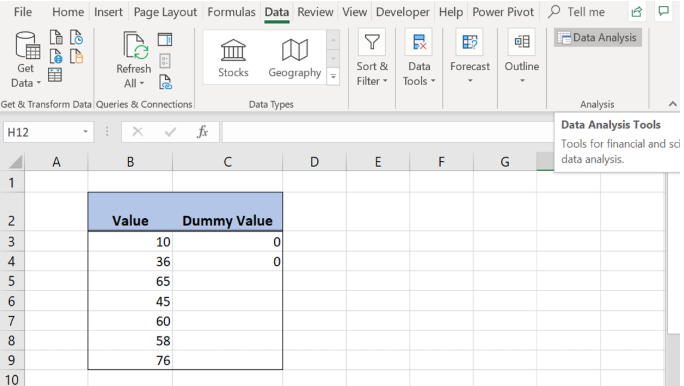
- Click on the Data tab and select Data Analysis.
- Select the T Test: Two-Sample Assuming Unequal Variances option.
- Select the columns containing the data, and click OK.
- A new window will appear with the results of the T Test.
Your results will include the mean of each group, the standard deviation of each group, the number of observations, and the T Test statistic.

Running a T Test in Excel
A t-test is a type of statistical test used to compare the means of two samples. It is commonly used to determine if the means of two groups are significantly different from each other. T-tests can be used in Microsoft Excel to analyze data and determine whether the difference between two samples is statistically significant. In this article, we will discuss how to run a t-test in Excel.
To start, you need to enter the data for the two samples into an Excel spreadsheet. The data should be arranged in columns with the first column containing the values for the first sample and the second column containing the values for the second sample. Once the data is entered, you can then run a t-test by using the “Data Analysis” tool in Excel.
Steps to Run a T Test in Excel
The first step in running a t-test in Excel is to select the “Data Analysis” tool from the “Data” tab. This will open the “Data Analysis” dialog box. In this dialog box, select the “t-Test: Two-Sample Assuming Unequal Variances” option.
Once the option is selected, you will be prompted to enter the range of cells containing the data for the two samples. The first sample should be entered in the “Variable 1 Range” and the second sample should be entered in the “Variable 2 Range”. Once the ranges are entered, you can then click the “OK” button to run the t-test.
Interpreting the Results of a T Test in Excel
Once the t-test is run, the results will be displayed in the “Output” tab of the “Data Analysis” dialog box. The results will include the mean, standard deviation, and degrees of freedom for each sample. The t-statistic and p-value are also included. The t-statistic is used to determine whether the difference between the two samples is statistically significant. If the p-value is less than 0.05, then the difference between the two samples is statistically significant.
Using the Results of a T Test in Excel
Once the results of the t-test are obtained, they can be used to make decisions about the data. For example, if the p-value is less than 0.05, then the difference between the two samples is statistically significant and can be used to make conclusions about the data.
Tips for Running a T Test in Excel
When running a t-test in Excel, it is important to ensure that the data is entered correctly and that the correct options are selected. It is also important to note that the t-test assumes that the two samples have equal variances.
Using Other Statistical Tests in Excel
In addition to the t-test, other statistical tests can also be run in Excel. These tests include the chi-square test, the ANOVA test, and the correlation coefficient test. Each of these tests can be used to analyze data and determine whether the difference between two samples is statistically significant.
Frequently Asked Questions
Q1. What is a T Test?
A T Test is a statistical test used to determine whether there is a significant difference between the means of two independent groups. It is a type of hypothesis testing used to compare the mean of two samples and assess whether there is a statistically significant difference between them. The T Test is commonly used in research to determine whether a treatment or intervention has an effect on a dependent variable.
Q2. What is the purpose of a T Test?
The purpose of a T Test is to determine whether there is a statistically significant difference between the means of two independent groups. This test is used to assess whether a treatment or intervention has an effect on a dependent variable. It is also used to compare the means of two samples and determine if there is a significant difference between them.
Q3. How do you run a T Test in Excel?
To run a T Test in Excel, you will need to enter the data into a spreadsheet. Once the data has been entered, select the “Data” tab and then choose “Data Analysis.” In the Data Analysis menu, select “T Test: Two-Sample Assuming Equal Variances.” Enter the data for the two samples, the significance level, and the output range. Click “OK” and the results of the T Test will be displayed in the chosen output range.
Q4. What type of data is required for a T Test?
For a T Test, you will need two sets of data. The two sets of data should measure the same dependent variable for two different groups. The data should be numerical and should be normally distributed.
Q5. What is the significance level for a T Test?
The significance level for a T Test is typically set at 0.05. This means that the results of the test must show a statistically significant difference between the two groups at a 95% confidence level in order to be considered valid.
Q6. What are the assumptions for a T Test?
The assumptions for a T Test include that the two samples have the same variance, that the data is normally distributed, and that the samples are independent and randomly selected. Additionally, it is assumed that the samples are from populations with similar variances and that the observations in each sample are independent.
Once you know the basics of how to run a t-test in Excel, you can use the tool to your advantage. It is easy to use, efficient, and reliable. With a few simple steps, you can use this powerful statistical tool to quickly and accurately analyze your data. Try it out today and see how it can help you improve your research and decision-making process.
How to Create Tabs Within Tabs in Excel?
How to Do Integration in Excel?
Related Posts

Small businesses struggle with ERC tax credit submissions

10 Misunderstandings of the Employee Retention Credit

ERC Tax Credit 2023: Is the ERC tax credit still available?
