
How to Perform a Chi Square Test in Excel?
Are you looking to understand how to perform a chi square test in Excel? Then you’ve come to the right place! In this article, we’ll be exploring the basics of the chi square test, its key concepts, and how to actually run the test in Excel. By the end, you should be ready to confidently use this powerful statistical tool to analyze your data. So let’s get started!
Chi Square Test in Excel: To perform a Chi Square Test in Excel, you need to use the CHITEST function. Start by entering the observed frequencies in one column and the expected frequencies in another. Then, enter the CHITEST function in a third column, with the following syntax: =CHITEST(observed frequencies range, expected frequencies range). The result of the function will be the Chi Square statistic and its associated P-value, which you can interpret to assess the significance of the results.
To learn how to perform a Chi Square Test in Excel step-by-step, follow these instructions:
- Open Microsoft Excel.
- Create a spreadsheet with the observed frequencies in one column and the expected frequencies in another.
- Enter the CHITEST function in a third column, with the following syntax: =CHITEST(observed frequencies range, expected frequencies range).
- Press Enter to calculate the Chi Square statistic and its associated P-value.
- Interpret the results to assess the significance of the Chi Square Test.

Introduction to Chi Square Test in Excel
Chi Square Test is a statistical procedure used to test the association between two categorical variables. The chi square test is most commonly used to determine whether two variables are independent of each other. It can also be used to compare the observed frequencies of different outcomes against the expected frequencies. Excel provides a number of statistical functions that can be used to perform a chi-square test.
What is a Chi Square Test?
A chi square test is a statistical test used to compare observed frequencies of categorical variables with expected frequencies. It is used to determine if there is a significant difference between the observed and expected frequencies. The chi-square test is used to test the null hypothesis that the two variables are independent. The chi-square test is used to test the association between two categorical variables.
How to Perform a Chi Square Test in Excel?
To perform a chi-square test in Excel, you will need to first enter the observed frequencies in the appropriate cells. Once the observed frequencies are entered, you can use the chi-square test function to calculate the chi-square statistic. The chi-square statistic is the sum of the squared differences between the observed and expected frequencies.
Steps to Perform Chi Square Test in Excel
Step 1: Enter the Data
The first step in performing a chi-square test in Excel is to enter the observed frequencies in the appropriate cells. The observed frequencies should be entered in the same row or column.
Step 2: Calculate the Chi-Square Statistic
The next step is to calculate the chi-square statistic. The chi-square statistic is the sum of the squared differences between the observed and expected frequencies. The chi-square statistic can be calculated using the Excel function CHISQ.DIST.
Step 3: Interpret the Results
The last step is to interpret the results of the chi-square test. The chi-square statistic is used to test the null hypothesis that the two variables are independent. If the chi-square statistic is greater than the critical value, then the null hypothesis is rejected. This indicates that there is a significant association between the two variables.
Conclusion
In conclusion, a chi square test is a statistical test used to compare observed frequencies of categorical variables with expected frequencies. Excel provides a number of statistical functions that can be used to perform a chi-square test. The steps to perform a chi-square test in Excel are to enter the observed frequencies, calculate the chi-square statistic, and interpret the results.
Frequently Asked Questions
What is a Chi Square Test?
A Chi-square test is a statistical hypothesis test used to determine if there are significant differences between the expected frequencies and the observed frequencies in one or more categories. It is most commonly used to test relationships between categorical variables. The test is based on the chi-square statistic, which measures the difference between observed and expected frequencies.
What Data is Required for a Chi Square Test in Excel?
In order to perform a chi-square test in Excel, you must have two sets of data: an observed data set and an expected data set. The observed data set is a set of values that you have actually observed in a given situation. The expected data set is a set of values that you would expect to see if the null hypothesis were true. The chi-square test compares the observed and expected data to determine if there is a significant difference between them.
What is the Formula for a Chi Square Test in Excel?
The formula for a chi-square test in Excel is:
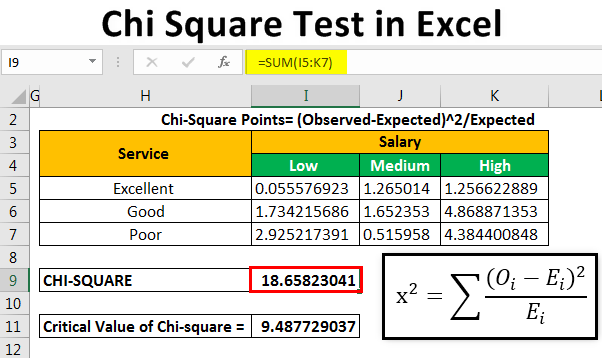
Chi Square = Σ (Oi – Ei)2 / Ei
Where Oi is the observed frequency in the ith column, Ei is the expected frequency in the ith column and Σ is the sum of all the elements.
How Do You Interpret the Results of a Chi Square Test in Excel?
The results of a chi-square test in Excel are interpreted using the chi-square statistic, which is calculated by subtracting the expected frequency from the observed frequency, and then dividing by the expected frequency. If the obtained chi-square statistic is greater than the critical value, then the null hypothesis can be rejected. A higher chi-square statistic indicates a greater difference between the observed and expected frequencies.
What are the Assumptions of a Chi Square Test in Excel?
The assumptions of a chi-square test in Excel include that the data is randomly sampled and that the expected frequencies are greater than five for each value in the data set. Additionally, the chi-square test assumes that the data is independent and that the variances of the two populations are equal.
What are the Limitations of a Chi Square Test in Excel?
The limitations of a chi-square test in Excel include that it is only suitable for categorical data and that it is sensitive to sample size. Additionally, the chi-square test assumes that the variables are independent, which may not always be the case. Finally, the chi-square test is not suitable for testing relationships between continuous variables.
How to Calculate Chi Square Using Excel =CHISQ.TEST and =CHISQ.INV.RT
Performing a Chi Square Test in Excel can be a great way to analyze data and get meaningful results. It is a powerful tool that can help you find correlations between different variables and make informed decisions. By following the steps outlined in this article, you can quickly and easily create a Chi Square Test in Excel and get the answers you need. With a little practice, you can become an expert at running this powerful statistical test.
How to Remove Duplicate in Excel?
How to Calculate Monthly Loan Payment in Excel?
Related Posts

Small businesses struggle with ERC tax credit submissions

10 Misunderstandings of the Employee Retention Credit

ERC Tax Credit 2023: Is the ERC tax credit still available?
