
How to Get Correlation Coefficient in Excel?
Are you trying to figure out how to calculate the correlation coefficient in Excel? If so, you’ve come to the right place! In this article, we’ll go over the basics of correlation coefficients and how to calculate them in Excel. We’ll also cover some tips and tricks on how to get the most out of your results. With this information, you’ll be able to confidently analyze and interpret data, and make decisions based on the insights you gain. So, let’s get started!
- Open a new spreadsheet in Microsoft Excel
- Enter your data into two columns
- Select the two columns you want to compare
- Go to the Data tab on the top ribbon
- Look for the Analyze group and click on Data Analysis
- Choose “Correlation” from the list of tools
- Click OK and the result will appear in a new window

Introduction to Correlation Coefficient in Excel
Correlation coefficient is a statistical measure used to measure the strength of a linear relationship between two variables. It is used to determine the linear relationship between two sets of variables by calculating the correlation coefficient between them. In Excel, it is possible to calculate the correlation coefficient of two sets of data with the help of the CORREL function.
Steps to Get Correlation Coefficient in Excel
Step 1: Setup the Data
The first step to calculate the correlation coefficient in Excel is to set up the data. The data should be arranged in two columns with each column containing the same number of data points. The data should not contain any blank values or errors.
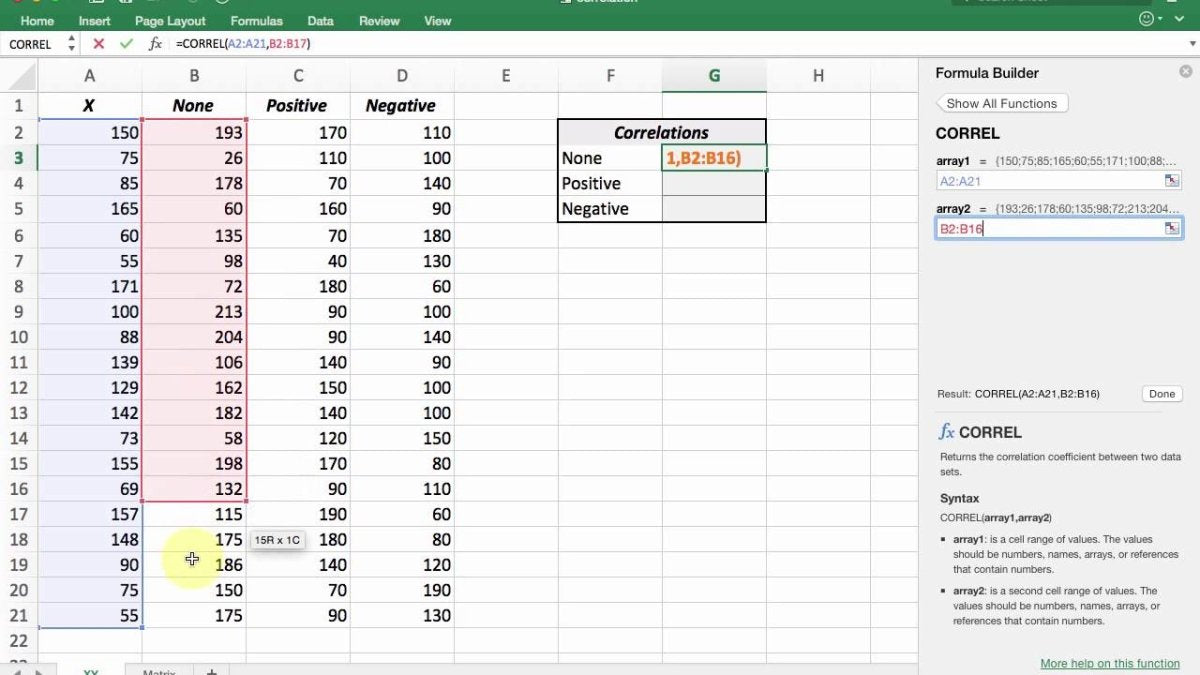
Step 2: Enter the Formula
Once the data is set up, the next step is to enter the CORREL formula in the cell where the correlation coefficient is to be calculated. The formula should be entered as =CORREL(range1,range2), where range1 is the range of the first set of data and range2 is the range of the second set of data.
Step 3: Calculate the Correlation Coefficient
Once the formula is entered, the result of the calculation should be displayed in the cell. The result is a number between -1 and 1, where -1 indicates a perfect negative linear relationship and 1 indicates a perfect positive linear relationship.
Interpreting the Correlation Coefficient
Weak Correlation
A weak correlation is indicated by a coefficient of less than 0.3, which indicates that there is no strong linear relationship between the two sets of data.
Moderate Correlation
A moderate correlation is indicated by a coefficient of between 0.3 and 0.7, which indicates that there is a moderate linear relationship between the two sets of data.
Potential Errors
Missing Data
If one or more of the cells in the data range contain missing values or errors, the calculation of the correlation coefficient will be incorrect.
Incorrect Range
If the range of data used for the calculation of the correlation coefficient is incorrect, the calculation will be incorrect. It is important to ensure that the correct range of data is used.
Frequently Asked Questions
What is a Correlation Coefficient?
A correlation coefficient is a statistical measure that calculates the strength of the relationship between two variables. It is a numerical value that ranges from -1 to +1, where -1 indicates a perfect negative correlation and +1 indicates a perfect positive correlation. A correlation coefficient of 0 indicates that there is no relationship between the variables.
What are the steps to get Correlation Coefficient in Excel?
The steps to getting the correlation coefficient in Excel are as follows:
1. First, open the data in Excel and select two columns.
2. Then, click on the Data tab and select Data Analysis.
3. In the Data Analysis window, select the Correlation tool.
4. In the Correlation window, select the two columns of data that you want to calculate the correlation coefficient for.
5. Finally, click OK and the correlation coefficient will be displayed in a new window.
How to Interpret the Correlation Coefficient?
The interpretation of the correlation coefficient depends on the sign of the value. A positive correlation coefficient indicates that there is a positive relationship between the two variables, meaning that as one variable increases, the other variable also increases. A negative correlation coefficient indicates that there is a negative relationship between the two variables, meaning that as one variable increases, the other variable decreases. A correlation coefficient of 0 indicates that there is no relationship between the two variables.
What are the Limitations of Correlation Coefficient?
The correlation coefficient is limited in its ability to predict relationships between variables. It only measures the strength of the linear relationship, meaning it can only be used to measure the strength of a linear relationship. Additionally, the correlation coefficient cannot be used to determine causation, as it only measures the strength of the relationship between two variables.
What are the Different Types of Correlation Coefficients?
There are several different types of correlation coefficients, including Pearson’s correlation coefficient, Spearman’s correlation coefficient, and Kendall’s correlation coefficient. Each of these correlation coefficients measures the strength of the linear relationship between two variables. Pearson’s correlation coefficient is the most commonly used correlation coefficient, as it is the most reliable and accurate.
When Should Correlation Coefficients be Used?
Correlation coefficients should be used when trying to measure the strength of the linear relationship between two variables. They should not be used to measure the strength of a non-linear relationship or to determine causation. Additionally, correlation coefficients should only be used when there is a large sample size and when the variables are normally distributed.
If you’re looking to calculate correlation coefficients in Excel, you now have a few different methods to choose from. Using the CORREL function or PEARSON function is the most straightforward and accurate way to get your correlation coefficient in Excel. You can also use the Scatter Plot tool to get a visual representation of correlation between two variables. Finally, you can also use the Data Analysis ToolPak if you have the appropriate add-in installed. No matter which method you choose, you’ll be able to easily get correlation coefficients in Excel.
How to Make a Time Series Graph in Excel?
How to Switch Between Tabs in Excel?
Related Posts

Small businesses struggle with ERC tax credit submissions

10 Misunderstandings of the Employee Retention Credit

ERC Tax Credit 2023: Is the ERC tax credit still available?
