
How to Calculate the Correlation Coefficient in Excel?
Do you need to calculate the correlation coefficient in Excel? If so, you have come to the right place! In this article, we will walk you through the steps for calculating the correlation coefficient in Excel. We will explain what the correlation coefficient is, why it is important, and provide step-by-step instructions for how to calculate the correlation coefficient in Excel. So if you’re ready to learn how to calculate the correlation coefficient in Excel, let’s get started!

Introduction to Calculating Correlation Coefficient in Excel
The correlation coefficient is a measure of the strength of the linear relationship between two variables. It is a number between -1 and 1 and is often expressed as a percentage. It can be used to determine whether two variables are related and to what extent they are related. Excel provides a convenient way to calculate the correlation coefficient. This article will explain how to calculate the correlation coefficient in Excel.
Steps for Calculating Correlation Coefficient in Excel
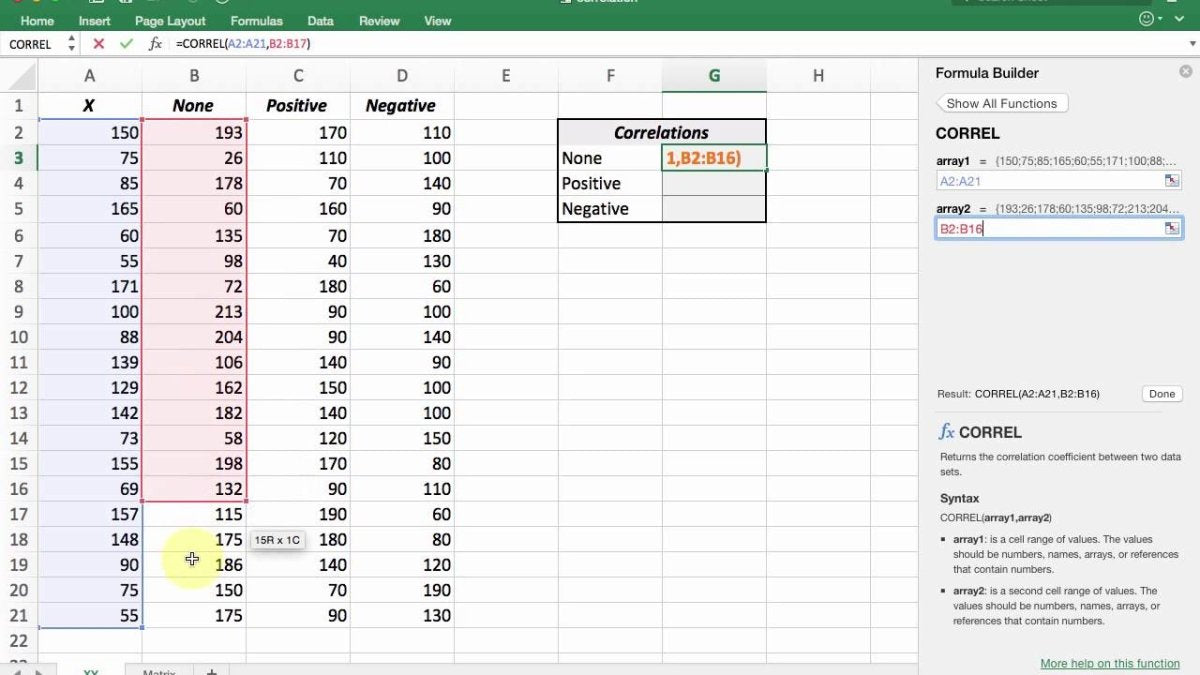
The first step in calculating the correlation coefficient in Excel is to enter the data for the two variables into two columns. The data should be entered in the same order for both variables. For example, the first row should contain the first data point for both variables.
The second step is to select the two columns of data. This can be done by clicking and dragging the mouse over the two columns. Once the data is selected, the correlation coefficient can be calculated by going to Data > Data Analysis > Correlation. This will open a window where the input range, output range, and other options can be specified.
The third step is to click the “OK” button in the Correlation window. This will calculate the correlation coefficient and display it in the output range. The result will be a number between -1 and 1. A number close to 1 indicates a strong positive correlation, a number close to -1 indicates a strong negative correlation, and a number close to 0 indicates no correlation.
Interpreting the Correlation Coefficient
The correlation coefficient can be used to interpret the strength of the relationship between two variables. A coefficient close to 1 or -1 indicates a strong relationship, while a coefficient close to 0 indicates no relationship. It is important to keep in mind that the correlation coefficient does not indicate causation; in other words, a high correlation does not necessarily indicate that one variable causes the other.
Limitations of the Correlation Coefficient
The correlation coefficient is a useful tool for determining the strength of the relationship between two variables, but it has its limitations. One limitation is that it does not take into account non-linear relationships. For example, if the relationship between two variables is quadratic, the correlation coefficient may not accurately reflect the strength of the relationship. Additionally, the correlation coefficient does not indicate the direction of the relationship; it only indicates the strength of the relationship.
Conclusion
Calculating the correlation coefficient in Excel is relatively straightforward and can be used to determine the strength of the linear relationship between two variables. It is important to keep in mind, however, that the correlation coefficient does not indicate causation and does not take into account non-linear relationships.
Frequently Asked Questions
What is the Correlation Coefficient?
The correlation coefficient is a numerical measurement of the degree of correlation between two variables. It can range from -1, which indicates a perfect negative correlation, to +1, which indicates a perfect positive correlation. A correlation coefficient of 0 indicates that there is no correlation between the two variables.
What is the Formula for Calculating the Correlation Coefficient?
The formula for calculating the correlation coefficient is as follows:
r = (n∑xy – ∑x∑y) / √
Where:
r = correlation coefficient
n = number of data points
x & y = individual data points
∑x = sum of all x values
∑y = sum of all y values
What is the Procedure for Calculating the Correlation Coefficient in Excel?
The procedure for calculating the correlation coefficient in Excel is as follows:
1. Select two sets of data to compare.
2. Enter the data into two columns in an Excel spreadsheet.
3. Select the two columns of data.
4. Click on the “Data” tab and select “Data Analysis”.
5. Select “Correlation” in the Data Analysis window.
6. Click “OK”.
7. Excel will output the correlation coefficient (r).
What Does the Result of the Correlation Coefficient Mean?
The result of the correlation coefficient will indicate the degree of correlation between the two variables. A positive correlation coefficient indicates that the two variables have a positive relationship (i.e. as one variable increases, the other also increases). A negative correlation coefficient indicates that the two variables have a negative relationship (i.e. as one variable increases, the other decreases). A correlation coefficient of 0 indicates that there is no correlation between the two variables.
What is the Difference Between the Correlation Coefficient and the Coefficient of Determination?
The correlation coefficient is a measure of the strength of the linear relationship between two variables. The coefficient of determination (r2) is a measure of the amount of variability in one variable that is explained by the other variable. The coefficient of determination is calculated by squaring the correlation coefficient.
What is the Limitation of Using the Correlation Coefficient?
The correlation coefficient is a measure of the strength of the linear relationship between two variables. It is limited in that it only measures linear relationships and does not take into account nonlinear relationships. It also does not take into account other factors that could influence the relationship between the two variables.
Using Excel to calculate a correlation coefficient || interpret relationship between variables
The correlation coefficient can be a powerful tool for analyzing the relationships between different sets of data. Calculating the correlation coefficient in Excel is a simple process that can be completed in just a few steps. With a bit of familiarity with Excel and the correlation coefficient, you can easily use this tool to analyze your data and understand more about the relationships between them.
Related Posts

Small businesses struggle with ERC tax credit submissions

10 Misunderstandings of the Employee Retention Credit

ERC Tax Credit 2023: Is the ERC tax credit still available?
