Why Tableau is Better Than Power Bi?
Tableau and Power BI are both powerful data visualization tools that allow business users to quickly analyze and present data in meaningful ways. But which one is better? In this article, we’ll look at why Tableau is generally regarded as the superior choice for data visualizations. We’ll explore the advantages of Tableau over Power BI, including its robust features, intuitive user interface and scalability. Finally, we’ll discuss why Tableau is the top choice for data visualization when compared to Power BI.
Tableau is better than Power BI for several reasons. It offers an easy-to-use interface that allows users to quickly connect to data sources and create powerful visualizations. Tableau also offers more robust analytics capabilities and a wide range of customizations. Tableau also has a much larger library of templates and data sources, making it easier to create complex visualizations. Finally, Tableau has a much larger community of users who are willing to share their knowledge and help others.
Why Tableau is Better Than Power BI?
Tableau is Easier to Use
Tableau is a powerful business intelligence and analytics platform, and it is far easier to use than Power BI. With Tableau, users don’t need to have any programming knowledge or technical skills. All they have to do is connect to their data sources and start exploring. Tableau’s drag-and-drop features make it easy to create stunning visualizations, quickly and easily. Tableau has an intuitive user interface, which makes it easy for even novice users to get started quickly.
Tableau’s built-in analytics tools also make it easy to analyze and visualize data. Tableau has a range of sophisticated analytics tools, such as trend lines and forecasting, that allow users to quickly identify patterns and insights in their data. Tableau also has a range of advanced analytics features, such as predictive analytics and machine learning, that allow users to gain more insights from their data.
Tableau is More Flexible
Tableau is also more flexible than Power BI. Tableau allows users to connect to a wide range of data sources, including cloud-based data sources and on-premise data sources. This makes it easy for users to access and analyze data from multiple sources. Tableau also has a wide range of powerful data integration and blending capabilities, which make it easy for users to combine and analyze data from multiple sources.
Tableau also has a range of powerful data visualization tools, which make it easy for users to create stunning visualizations. Tableau’s drag-and-drop interface and built-in templates make it easy for users to create stunning visualizations quickly and easily. Tableau also has a wide range of powerful data exploration tools, which make it easy for users to quickly identify patterns and insights in their data.
Tableau is More Affordable
Finally, Tableau is more affordable than Power BI. Tableau offers a range of pricing plans, which make it easy for users to find a plan that fits their budget. Tableau also offers a free version, which makes it easy for users to get started quickly. Tableau is also more scalable than Power BI, which makes it easy for users to grow their usage as their business grows.
Tableau also offers a range of discounts and promotions, which make it easy for users to get the best deal on their Tableau products. Tableau also offers a range of training and support options, which make it easy for users to get the help they need.
Tableau is More Secure
Tableau is more secure than Power BI. Tableau is compliant with a range of security standards, such as HIPAA, GDPR, and CIS. This makes it easy for users to ensure their data is secure and compliant. Tableau also has a range of security features, such as user authentication and data encryption, which make it easy for users to protect their data.
Tableau also has a range of audit logging features, which make it easy for users to track user activity. Tableau also has a range of data governance features, which make it easy for users to control who can access and edit their data.
Tableau is More Reliable
Tableau is also more reliable than Power BI. Tableau has a range of features, such as automated backups and data replication, which make it easy for users to ensure their data is always available and up-to-date. Tableau also offers a range of disaster recovery features, which make it easy for users to restore their data in the event of a disaster.
Tableau also offers a range of performance-enhancing features, such as query optimization and caching, which make it easy for users to ensure their data is always fast and responsive. Tableau also has a range of monitoring features, which make it easy for users to identify and troubleshoot performance issues quickly.
Tableau Has a Strong Community
Tableau also has a strong community of users and developers. Tableau has an active online user community, which makes it easy for users to find answers to their questions and get help from experienced users. Tableau also has a large and active developer community, which makes it easy for users to find solutions to their problems and get help from experienced developers.
Tableau also has a range of online resources, such as tutorials, forums, and blogs, which make it easy for users to learn more about Tableau and get the most out of their Tableau experience. Tableau also has a range of user groups and events, which make it easy for users to connect with other Tableau users and share best practices.
Tableau Has a Range of Integrations
Finally, Tableau has a range of integrations with other popular business applications, such as Salesforce, QuickBooks, and Zendesk. This makes it easy for users to access and analyze data from multiple sources. Tableau also has a range of integrations with other data sources, such as Hadoop and MongoDB, which make it easy for users to access and analyze data from a wide range of sources.
Tableau also has a range of integrations with popular analytics tools, such as Google Analytics and Adobe Analytics, which make it easy for users to gain deeper insights into their data. Tableau also has a range of integrations with popular visualization tools, such as D3 and Highcharts, which make it easy for users to create stunning visualizations quickly and easily.
Few Frequently Asked Questions
What is Tableau?
Tableau is a business intelligence platform that helps to create interactive visualizations from data sources. It is used by business analysts, data scientists, and other data professionals to quickly and easily analyze their data and create visualizations for their data-driven decision-making. Tableau is designed to be easy to use and provides an array of powerful data visualization and analysis capabilities. Tableau also offers a range of features that make it easier to collaborate and share visualizations, encourage collaboration, and make it easier to integrate with other business intelligence tools.
What is Power BI?
Power BI is a business intelligence platform from Microsoft that provides data visualization and analytics capabilities. It is designed to help businesses quickly and easily turn their data into insights and decisions. Power BI provides a range of features that enable users to connect to data sources, analyze and visualize data, and share insights with others. Power BI also offers a range of features that make it easier to collaborate and share insights, create interactive dashboards and reports, and integrate with other business intelligence tools.
Why is Tableau Better Than Power BI?
Tableau provides a more user-friendly interface than Power BI, making it easier for users to quickly and easily analyze their data and create visualizations. Tableau also offers a range of features that make it easier to collaborate and share visualizations. Additionally, Tableau offers a range of advanced data visualization and analysis capabilities that are not available in Power BI. Tableau also has a more robust security model and integrates better with other business intelligence tools.
What Are the Advantages of Tableau?
Tableau provides a user-friendly interface, making it easier for users to quickly and easily analyze their data and create visualizations. Tableau also offers a range of features that make it easier to collaborate and share visualizations. Additionally, Tableau offers a range of advanced data visualization and analysis capabilities that are not available in Power BI. Tableau also has a more robust security model and integrates better with other business intelligence tools.
What Are the Advantages of Power BI?
Power BI provides a range of features that enable users to connect to data sources, analyze and visualize data, and share insights with others. Power BI also offers a range of features that make it easier to collaborate and share insights, create interactive dashboards and reports, and integrate with other business intelligence tools. Additionally, Power BI has a range of features that make it easier to publish content and embed insights in web applications and websites.
Which Platform is Better for Data Analysis?
The best platform for data analysis depends on the specific needs of the user. Tableau offers a more user-friendly interface and a range of advanced data visualization and analysis capabilities that are not available in Power BI. However, Power BI has a range of features that make it easier to collaborate and share insights, create interactive dashboards and reports, and integrate with other business intelligence tools. Therefore, it is best to assess the specific needs of the user and determine which platform is best for their data analysis needs.
Tableau has proven itself to be a powerful data visualization and analytics tool that is better than Power BI in a number of ways. It offers a wide range of features, from interactive dashboards and data blending to easy-to-use drag-and-drop functionality. It also provides the ability to quickly and easily create interactive visualizations, allowing users to quickly and easily gain insights into their data. Ultimately, Tableau’s robust features, intuitive design, and powerful data visualization capabilities make it a better choice than Power BI for those looking to quickly and easily gain insights from their data.
Related Posts
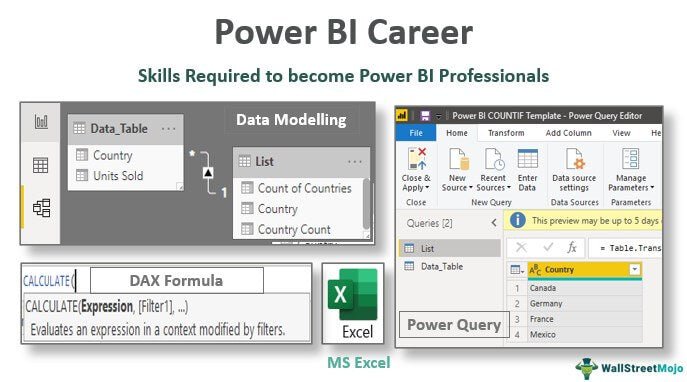
Switch Careers with Power BI Career: Your Path to Success
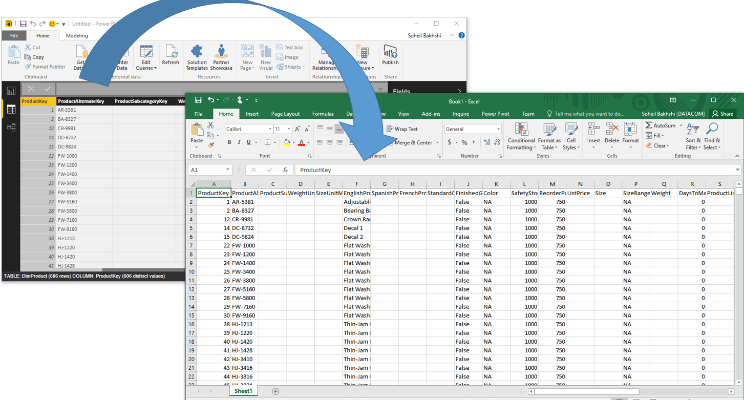
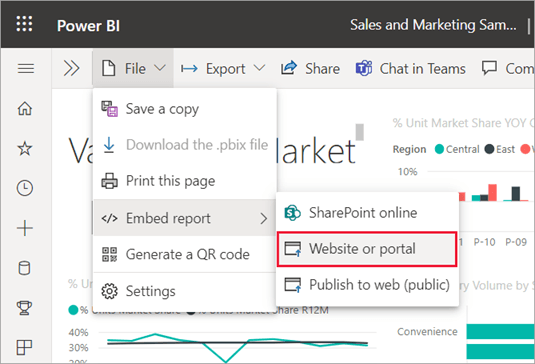
How to Export Power Bi Report to Excel?

How to Explain Power Bi Project in Interview?
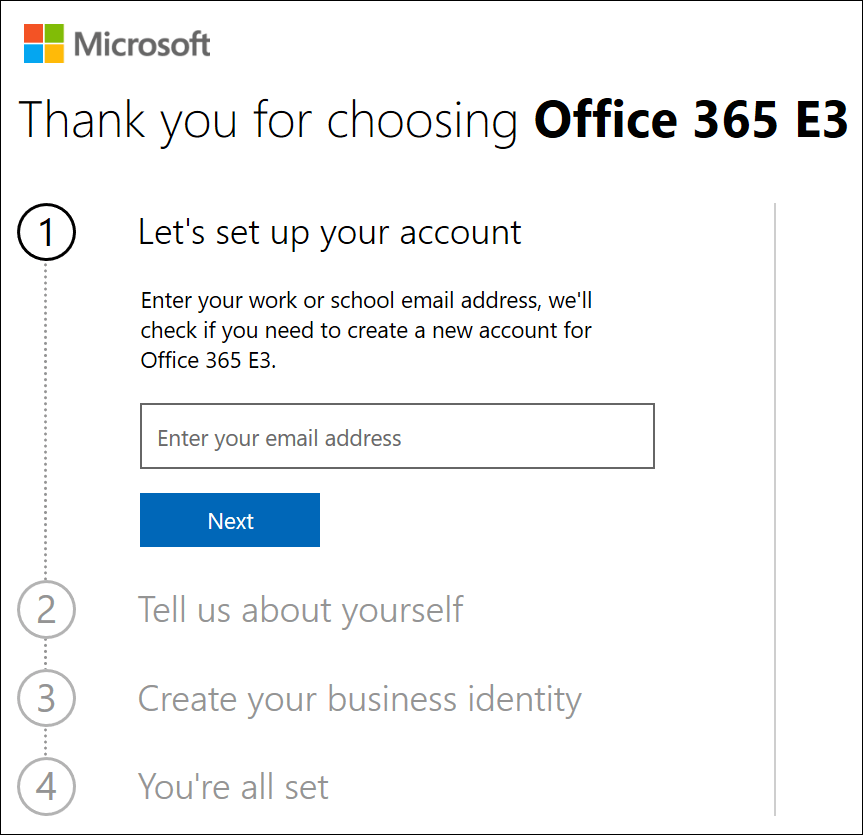
How to Enable Power Bi in Office 365?