What is Power View in Power Bi?
Power View is an interactive data visualization tool that is part of the Microsoft Power BI suite. It allows users to quickly and easily create stunning visualizations with their data. In this article, we will explore what Power View is, how it can be used, and the benefits it can provide. Let’s dive in and discover the power of Power View for your data analytics!

What is Power View in Power BI?
Power View is a data visualization tool available in Microsoft Power BI, an analytics and business intelligence platform. It allows users to create interactive data visualizations such as charts, graphs, and maps. Power View also enables users to share their visualizations with colleagues, enabling better collaboration and insights.
Power View is an extremely powerful tool that enables users to quickly and easily create visualizations from their data. It is easy to use and can be used to create visualizations for a variety of purposes, including customer segmentation, customer segmentation, customer retention, and customer satisfaction. Power View can also be used to create visualizations for data exploration and predictive analytics.
Power View also provides users with the ability to customize their visualizations. Users can change the colors, fonts, and sizes of their charts, as well as add labels and annotations. This allows users to create visualizations that are tailored to their specific needs.
How Does Power View Work?
Power View is a visualizing tool that enables users to create powerful data visualizations. It works by connecting users to their data sources and then enabling them to create visualizations from that data. Power View is easy to use and provides users with the ability to quickly and easily create visualizations from their data.
Power View supports a variety of data sources, including Excel, CSV, and text files. Once users connect to their data source, they can create visualizations from their data. They can also customize their visualizations by changing the colors, fonts, and sizes of their charts, as well as adding labels and annotations.
What are the Advantages of Power View?
Power View enables users to quickly and easily create powerful visualizations from their data. It is easy to use and provides users with the ability to customize their visualizations. Power View also supports a variety of data sources, making it easy to create visualizations from a variety of data sources.
Power View also enables users to easily share their visualizations with colleagues, enabling better collaboration and insights. Furthermore, Power View enables users to quickly and easily create visualizations for data exploration and predictive analytics.
How to Use Power View?
Using Power View is easy and straightforward. The first step is to connect to the data source. Power View supports a variety of data sources, including Excel, CSV, and text files. Once users connect to their data source, they can create visualizations from that data.
What are the Limitations of Power View?
Power View is a powerful tool, but it does have some limitations. For example, Power View does not support data sources such as SQL Server, Oracle, and Access. Additionally, Power View does not provide users with the ability to create visualizations from web or mobile data sources.
What are the Alternatives to Power View?
There are several alternatives to Power View, including Tableau, QlikView, and Zoho Reports. Each of these tools is a powerful data visualization tool that provides users with the ability to create visualizations from their data. However, Power View is the most popular tool for creating visualizations from data sources.
Frequently Asked Questions
What is Power View in Power Bi?
Answer: Power View in Power BI is a data visualization tool that enables users to create interactive and visually appealing reports. It provides users with the ability to create charts, graphs, and maps to help them gain insights from their data. Power View also allows users to interact with their data in real-time, allowing them to drill-down into specific areas of their data and gain valuable insights.
What Type of Data Can I Visualize with Power View?
Answer: Power View in Power BI can be used to visualize data from a variety of sources, including Excel, SQL Server, and other data sources. It can be used to create visualizations such as bar and column charts, line graphs, maps, scatter plots, and many more. Power View also supports the creation of interactive visualizations, allowing users to drill down into specific areas of their data and gain valuable insights.
What Are the Benefits of Using Power View?
Answer: Power View in Power BI offers a number of benefits, including the ability to create visually appealing and interactive reports. It also provides users with the ability to drill-down into specific areas of their data, allowing them to gain valuable insights. Additionally, Power View offers users the ability to customize their reports, making them unique and tailored to their individual needs.
How Do I Get Started with Power View?
Answer: Getting started with Power View in Power BI is easy. All you need to do is open the Power BI Desktop application and select ‘Power View’ from the list of available visualizations. From there, you can begin creating your visualizations and reports. You can also use the ‘Power View Designer’ to customize your reports and make them unique to your individual needs.
What Are the Limitations of Power View?
Answer: Power View in Power BI has some limitations in terms of the type of data it can visualize. For example, it cannot visualize data from non-relational databases and it is not able to render 3D visualizations. Additionally, Power View does not have the capability to render real-time data or to create calculations.
What Are the Best Practices for Using Power View?
Answer: When using Power View in Power BI, there are a few best practices to keep in mind. First, it is important to use the Power View Designer to customize your visualizations and reports to ensure they are tailored to your individual needs. Additionally, it is important to use the drill-down feature to gain insights from your data. Finally, it is important to use the ‘Save As’ feature to save your reports, ensuring they are secure and can be easily accessed in the future.
Power BI Tutorial (15/50) – What is Power Query / Power Pivot / Power View
Power View in Power BI is an incredibly powerful tool that can help you create stunning visuals and interactive dashboards in no time. With its intuitive drag-and-drop interface, it can help you to quickly and easily transform data into beautiful, insightful visuals that can help you better understand trends and patterns in your data. Power View in Power BI is an essential tool for anyone looking to unlock the power of their data and gain meaningful insights.
Related Posts
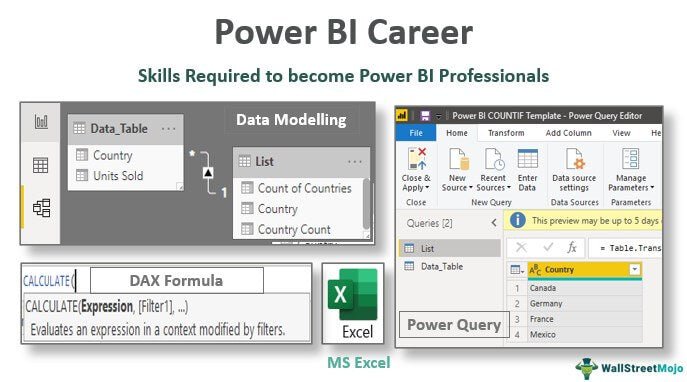
Switch Careers with Power BI Career: Your Path to Success
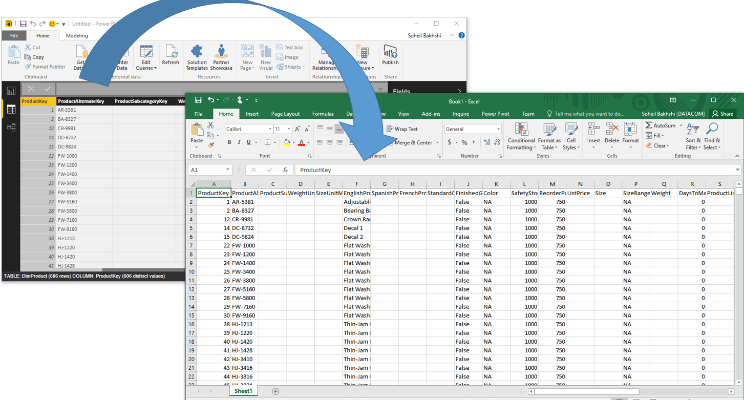
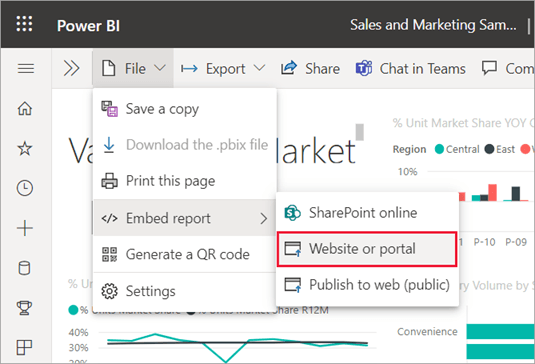
How to Export Power Bi Report to Excel?

How to Explain Power Bi Project in Interview?
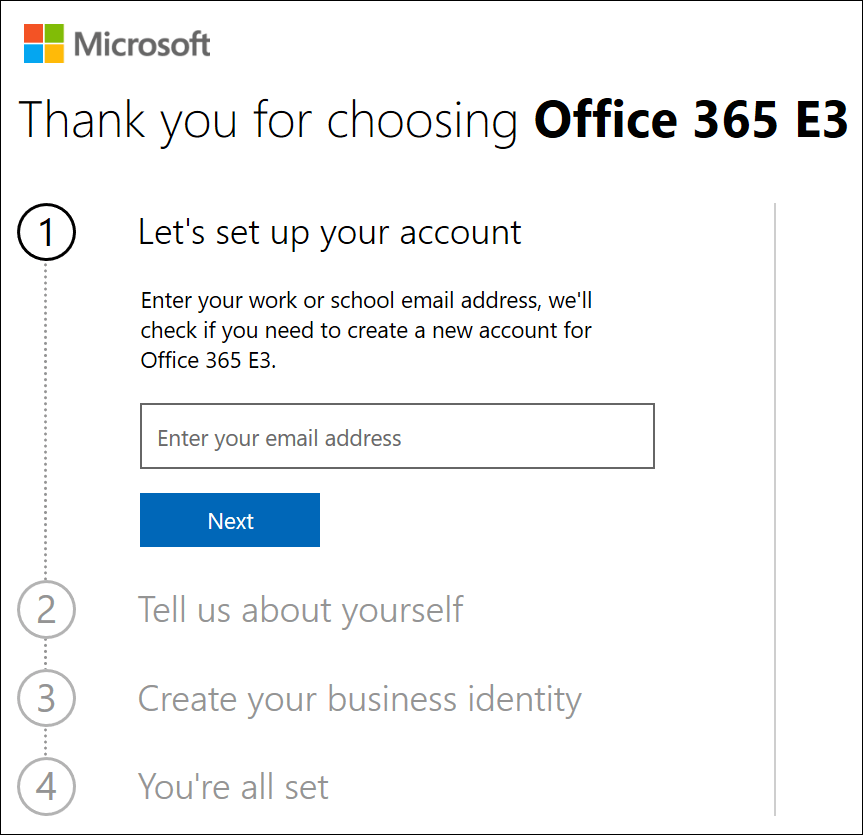
How to Enable Power Bi in Office 365?